Curated OER
Problem-Solving Application: Use a Graph
In this problem solving worksheet, 6th graders use the problem solving steps of understand, plan, solve and look back to answer a graphing question.
Curated OER
Bird Feeding and Migration Observation
Students research bird migration and build a bird house. In this bird lesson plan, students research the birds in their area and where they migrate to. They also build their own bird house and record data on what kinds of birds come to...
Curated OER
Probability Two Events
Students investigating the concept of probability practice the concept using a variety of different example problems. The instructional activity is delivered in a question and answer format. The frequency of answers is recorded in a data...
Curated OER
Creating Line Graphs
Learners draw line graphs. For this math lesson, students interpret minimum wage data and graph the data in a line graph. Learners predict the next minimum wage and figure the earnings for a 40 hour work week for someone earning the...
Curated OER
M & Ms in a Bag
Students make predictions about the number and colors of M&M's in a snack size package. They create an Excel spreadsheet to record the data from their small group's bag, create a graph of the data, and discuss the variations of data...
Curated OER
School Fair
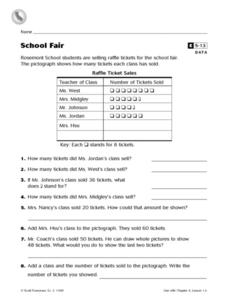
In this data worksheet, students look over a table containing data collected from selling raffle tickets and then answer 8 short answer questions relating to the table.
Curated OER
Too Many Tulips
In this graphing information instructional activity, students read 6 sentences and then fill in the chart with the appropriate information from the sentences.
Curated OER
Data Analysis Digital Display
Students create a survey online. In this math lesson, students graph survey data using flisti.com. They share and analyze their classmates' histogram.
Curated OER
Get the Picture with Graphs
Fifth graders examine line, bar and circle graphs in the newspaper and on the Internet. They complete sketches of graphs with an emphasis on selecting the best model to depict the data collected.
Curated OER
Patterns, Relations, and Functions
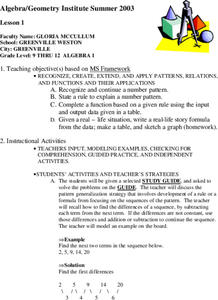
Young scholars investigate the patterns of different data sets of numbers. They use critical thinking skills in order to find the missing numbers in any given set. This lesson helps to develop the skill of number sense.
Curated OER
It's 'ELEMENT' ary
Middle schoolers, using a Web site about the periodic table of elements, create spreadsheets representing elements and their properties. They also create graphs that compare the physical properties of the elements.
Curated OER
Local Traffic Survey
Young scholars conduct a traffic survey and interpret their data and use graphs and charts to display their results.
Curated OER
Favourite Colours
In this colors instructional activity, students survey 20 people on what their favorite color is. They mark the results using tallies. Students then take their data and put the totals in a frequency table.
Curated OER
Walking on Air
Pupils collect and analyze data with a graph. In this statistics instructional activity, students use central tendencies to find the meaning of their data. They display the data on a Ti calculator.
Curated OER
Compare and Contrast Culture
Fifth graders compare and contrast the cultures of American culture with that of the other cultures of North America. Using traditional and Internet research, 5th graders gather data on one element of culture for comparison. Data...
Curated OER
The Human Line Plot
Fifth graders collect data and use charts and line plots to graph data. Through class surveys, 5th graders collect data concerning a particular subject. They graph their data using a line graph. Students make inferences and predictions...
Curated OER
Graphing Family Reading Habits
Second graders collect data from their families about their reading habits and graph them. In this graphing family reading habits instructional activity, 2nd graders interview family members about their reading habits. They then use a...
Curated OER
Skittles, Taste the Rainbow
Fifth graders learn and then demonstrate their knowledge of a bar and a circle graph using the classroom data. Students are given a pack of skittles candy. Students create a bar and circle graph indicating the results of the contents of...
Curated OER
Temperature Bar Graph
Students explore mean, median and mode. In this math lesson, students analyze temperature data and figure the mean, median, and mode of the data. Students graph the data in a bar graph.
Curated OER
Effects of Temperature, Deviation on Climate
Young scholars collect and record data for a given city. They calculate standard deviation of temperature and analyze the impact of climate changes on a city's and culture.
Curated OER
Periodic Trends
Students explore the rationale behind the arrangement of the elements on the Periodic Table. Using internet and traditional research, students compare and contrast the properties of elements on the periodic table to determine a...
Curated OER
The Sun
Based on chapter 23 of the Glencoe science textbook, this activity provides students with a table of observed sunspots and the years in which they were observed. Kids then answer a series of questions about the above information, using...
Curated OER
Olympic Line Graphs
Sixth graders examine how to make line graphs. In this Olympic line graph lesson students make line graphs and search the given Internet sites to find data on their summer Olympic Game.
Curated OER
Rain Formation
First graders investigate the different water formations by conducting an experiment. In this water properties lesson, 1st graders examine jars filled with ice, rain water, air and snow in their class. Students predict what will happen...


