Curated OER
Sunrise-Sunset
Young scholars gather data, make and share predictions about the time of sunrise ans sunset in their area. Patterns are analyzed and shared with students from other areas.
Curated OER
How Do You Get to School?
Third graders talk about all the various ways they get to school. They make a list of all the bus numbers that the students use. They also list all the other methods of transportation used and solidify a hypothesis.
Curated OER
How Much is There to Eat?
Students examine food production related to population density. In this interdisciplinary lesson, students gather data regarding food production in the American South and in India. Students follow the outlined steps to calculate the...
Curated OER
Probability: The Study of Chance
Students conduct an experiment, determine if a game is fair, and collect data. They interpret data, then display line graph. They conduct analysis of game for probability.
Curated OER
Orbital Bliss
Most young mathematicians are aware that the planets don’t orbit the sun in a circle but rather as an ellipse, but have never studied this interesting feature. This resource looks at the planetary orbits in more detail and helps learners...
Curated OER
Measuring Temperature and the Production of CO2 in Yeast
Students use a model experiment to complete an experiment on yeast. In groups, they identify the independent and dependent variables and use the scientific method to complete the activity. They record their observations and discuss them...
Curated OER
Race and Ethnicity in the United States
Students explore race and ethnicity as it is defined by the U. S. Census Bureau. They compare data from 1900, 1950, and 2000 and identify settlement patterns and changes in population. In groups, they map these changes and discuss...
Curated OER
Web Adventure -- Oakland to Chicago Flight
Students develop an awareness of mathematics in a diverse number of careers, then describe three duties of a pilot that require mathematical skills. They increase understanding of interpreting data relationships presented in table format.
Curated OER
Introduction to the Concept of Probability
Middle and high schoolers have a clarified definition of probability, they explore about outcomes in probability and how to calculate experimental probability. They use computers to learn about probability.
Curated OER
Hot Chocolate Lab
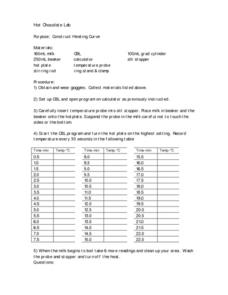
Students wear goggles and collect materials and then set up computer program to use the temperature probes. They insert the probe into the milk recording temperature every 30 seconds and then record the data on the table.
Curated OER
Investigation - Looking For Triangles
Seventh graders investigate a series of triangles, looking for patterns and generalizing what they have found. They analyze the pattern data and organize it into a table and graph. Students identify the relationship and discover the rule...
Curated OER
Ocean Life: A Heavy Subject
Second graders examine The Learning Page Fact Files about ocean life and categorize the data by weight and group. They distinguish between fish, mammals, and invertebrates and which weigh the most and the least. Students record their...
Curated OER
Old Glory
Learners utilize mathematical concepts such as: measurement, ratio and proportion and geometric probability to analyze the components of the U.S. Flag. They collect, organize and interpret data by constructing charts, tables and graphs...
Curated OER
Cover and Boarders
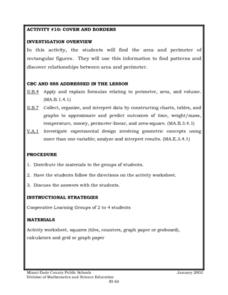
Students find the area and perimeter of rectangular figures. They use this information to find patterns and discover relationships between area and perimeter. Students apply and explain formulas relating to perimeter, area, and volume.
Curated OER
Will It Sink Or Float?
Have your class predict whether objects will sink or float in water. Learners consider a data table of mass, volume and whether the object sank or floated. They develop an evidence-based explanation for the results.
Curated OER
Echinacea No Cure all for Kids
Students look at real data and answer the question of whether or not they would recommend Echinacea to cure a cold. In this investigative instructional activity students describe whether the data supports the hypothesis that echinacea...
Curated OER
How Much Will That House Cost?
What is a mortgage and how do you use it to pay for a house? Young financiers determine how much money is actually spent paying a mortgage payment on a home. They use their math skills to calculate monthly payments on a home given a 30...
Curated OER
WATER QUALITY FOR FRESHWATER ORGANISMS
Students use determination of dissolved oxygen and water temperature changes to determine the environmental impact from thermal pollution.
Curated OER
Team Apollo
Seventh graders brainstorm about problems with a school track. They research different possibilities for a solution. They test different track materials with erosion, durability, abrasiveness and resiliency. They determine the area,...
Curated OER
The Heart Stopper
Use the pump from a spray bottle to drive a model of the heart in action! In addition to modeling the function of the heart and blood vessels, aspiring anatomists also simulate arterial blockage. They compare the effects of increased...
Curated OER
Curricular Correlations
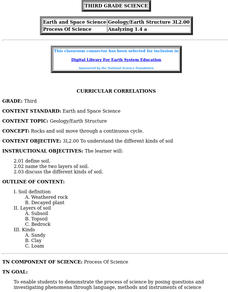
An interesting lesson on different types of soils is here for you. In it, learners discuss what soil is, and consider three piles of soil - clay, sand, and loam. During the rest of the lesson, third graders discover all sorts of...
Curated OER
Favorite Apple Graph
First graders record their favorite type of apple in the form of a graph. They each try one slice of a Red Delicious, Golden Delicious, and Granny Smith apple, select their favorite type, and create a class graph using the data collected.
Curated OER
Capture/Recapture
Students use proportions to estimate the size of populations. They describe the data with using a graph or table of the estimate. Students use descriptive statistics to calculate mean, median, and mode. They also compare and contrast an...
Curated OER
Baseball Math
Fifth graders complete activity pages. In this operations and problem solving lesson, 5th graders use the Internet to gather baseball statistics, solve problems and convert units.


