National Museum of Nuclear Science & History
Nuclear Popcorn
Make your lesson on radioactive decay pop with this lab exercise. Using popcorn kernels spread over a tabletop, participants pick up all of those that point toward the back of the room, that is, those that represent decayed atoms. As the...
Port Jefferson School District
Climate Patterns
Young climatologists explore the factors that contribute to a region's climate in this two-part earth science activity. To begin, learners are provided with a map of an imaginary planet and are asked to label global wind and ocean...
Curated OER
??Discovering Patterns and Trends of the Periodic Table using PDAs??
For this lesson, 10th graders research the elements within a particular period of the periodic table of elements. Students gather data from PDA for each element and join other individuals to decpher the patterns in the peridoc table.
Curated OER
Linear Patterns in Data
Eighth graders extend their learning of graphing linear equations and are introduced to connecting patterns in tables and graphs to represent algebraic representations. They then determine patterns and extrapolate information from these...
Curated OER
Using Coordinate Geometry by Land, Sea and Outer Space.
Students complete a table of values and plot points, as well as construct a graph on a coordinate grid. They construct two graphs on the same coordinate system, and identify the point of intersection. Students represent and record...
Curated OER
Epidemiology: Graphing and Analyzing Health Data
Students graph data on fetal and infant mortality rates collected by the Centers for Disease Control and Prevention. They identify trends in the data and propose potential causes for the trends.
Curated OER
INTRODUCTION TO THE PERIODIC TABLE
Students identify the scientist who first wrote the Periodic Table, identify the scientist who amended the Table, state (or write) specific data relating to the history of the Periodic Table, identify at least five elements, and two...
Curated OER
Handling Data: Coin Tossing Simulation
Students collect experimental data and record it on a frequency table. After accessing an Internet coin toss simulation site they discover that repetition of an experiment may result in different outcomes. They identify the mutually...
Curated OER
Using Charts and Graphs to Study East Asia's Modern Economy
Students examine East Asia's modern economy. In groups, classmates use the internet to compare the resources, products, and economy of specified countries. After collecting the data, pupils create charts, tables and graphs. They...
Curated OER
Using Computers to Produce Spreadsheets and Bar Graphs
Students review graphing terminology and how to plot data points, how to input data into a spreadsheet, and how to make a chart using a computer.
Curated OER
Periodic Table Lesson Plan
Students describe how elements are arranged on the periodic table. They compare metals, nonmetals, and metalloids based on their properties and on their locations in the periodic table. Students describe the differences between a...
Curated OER
Aquatic Field Data
Students use laptops and sensors to measure water quality and graph their results. In this aquatics lesson students post their results to a website or email.
Curated OER
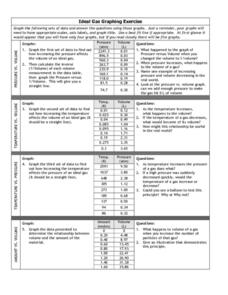
Graphing Exercise of Ideal Gas Data
For this graphing of Ideal Gas Data worksheet, students use the given data to draw 4 graphs of the given data. They are given the pressure and volume to draw and interpret the graphs.
Curated OER
Using Radiosonde Data From a Weather Balloon Launch
Student use radiosonde data from a weather balloon launch to distinguish the characteristics of the lower atmosphere. They learn the layers of the atmosphere. They graph real atmospheric data.
Curated OER
Using the Production Possibilities Frontier
Students identify the purpose of models and why economists use them. Using a graph, they practice reading and plotting points. They are introduced to a production possibilities frontier and draw their own from data supplied to them on...
Curated OER
Frequency Tables and Histograms
In this graph worksheet, 5th graders study the data presented on a bar graph. Students then respond to 4 short answer questions using the information that has been provided.
Curated OER
Data Analysis
In this data analysis worksheet, pupils solve and complete 4 different types of problems. First, they reduce the data provided to find the means, and graph the means in a line graph. Then, students graph the data from each mixture shown...
Curated OER
Mineral Exploration Using Remote Sensing
Learners use quantitative data that they gather to figure out where there is an ore body in their model. They describe how geologists could use similar information in order to figure geologic patterns and geologic history for a specific...
Curated OER
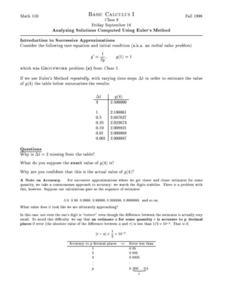
Analyzing Solutions Computed Using Euler's Method
In this analyzing solutions instructional activity, students use Euler's Method to estimate the value of given functions. They estimate solutions using the piecewise-linear function model and sketch the information onto a graph. This...
Curated OER
Heat of Formation using Hess's Law Lab
In this heat of formation worksheet, students determine the heat of formation for magnesium by combining 3 given reactions and using Hess's Law. Students then complete a data calculations chart for each reaction.
Curated OER
Population Study and Applications Using PTC Paper
Students study human population traits. In this science lesson plan, students gain an understanding of the terms dominant, recessive, haploid (monoploid), diploid, genotype, phenotype, scientific sampling, and scientific modeling as they...
Curated OER
Is That a Plan? Problem-Solving: Using Diagrams and Models
Student solve problems using a flow chart. They solve real-world problems by using a diagram or model. They create their own diagrams for problem-solving. They explain how they drew the diagram and solved the problem.
Curated OER
United States Population: Using Quadratic Models
In this United States population worksheet, students solve word problems about the United States population by using the quadratic formula. Students complete 6 problems.
Curated OER
Interpreting and creating tables
Young scholars observe examples and discuss how to interpret them. They then
brainstorm examples of possible questions students could use to create a table. They take time to formulate a question and collect data.


