Mathalicious
XBOX Xpotential
Touchdown! This is an exponentially insightful lesson that explores the growth of football games with different video game consoles. Class members discuss whether the increase of mergahertz can be described as linear or exponential. The...
Curated OER
Lining Up Data
Students examine the concept of function and make models of data and predictions based on that data.
Curated OER
First Grade Shoe Sizes
Third graders collect shoe size data from classmates in their room and another third grade. They predict what the most common shoe size will be. They place the data in an spreadsheet on the computer. They design a graph using the...
Curated OER
Tracking Ocean Ecology
Students look at the data maps given to them about how chlorophyll affects the algae blooms and make predictions about the harm they will cause. In this data maps lesson plan, students manipulate data sets from the website.
Curated OER
Canada at a Glance
Stjudents examine the statistics in a Canadian publication for use in graphs. They develop their own questions based on tables and graphs found in this publication..
Curated OER
Applied Science - Science and Math Lab
Students make a prediction. In this applied science instructional activity, students guess the number of items in a jar. Students create a bar graph to show the predictions and the actual amounts.
Curated OER
Valentine Candy Count
Young scholars analyze a bag of Valentine candy to create a graph. In this graphing lesson, students make predictions, sort by color, record data and make a graph. Young scholars discuss results and make generalizations. Students...
Curated OER
The Solar Cycle
Students research the solar cycle. In this Science lesson, students use the internet to investigate the solar cycle. Students produce a spreadsheet and graph from the information collected.
Curated OER
High Temperature records by State
In this temperatures worksheet, students view a spreadsheet of the high temperatures of the states and change the data on it using spreadsheet tools. Students complete 4 tasks.
Curated OER
The Rest of the Story
Third graders make predictions about the story "The True Story of the Three Little Pigs" based on background knowledge. They read the story, stopping to verify or reject predictions. They write their own opinionated fairytales.
Curated OER
Microbiology Lesson
Learners collect water samples and use a microscope to find bacteria in the samples. They categorize the different bacteria they find, determine the number of colonies there are, and predict how the bacteria levels might affect animals...
Curated OER
Students Analyze Data With Scatter Plots
Scatter plot lessons can help students create different types of graphs by hand or with the aid of technology.
Inside Mathematics
Archery
Put the better archer in a box. The performance task has pupils compare the performance of two archers using box-and-whisker plots. The resource includes sample responses that are useful in comparing individuals' work to others.
Teach Engineering
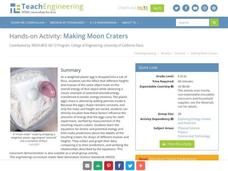
Making Moon Craters
Create an egg-citing study of energy. Pupils investigate the effect of height and mass on the overall amount of energy of a falling object. The fourth segment in a six-part series on energy uses a weighted egg falling from different...
Howard Hughes Medical Institute
Zebrafish and Skin Color
You may not know if that zebrafish in your fish tank is a model citizen—but it is definitely a model organism! What can we learn about ourselves from a tiny zebrafish? Discover more about the polygenic trait of skin color through a...
EngageNY
Modeling Riverbeds with Polynomials (part 2)
Examine the power of technology while modeling with polynomial functions. Using the website wolfram alpha, learners develop a polynomial function to model the shape of a riverbed. Ultimately, they determine the flow rate through the river.
Teach Engineering
Building a Barometer
Forget your local meteorologist — build your own barometer and keep track of the weather with an activity that provides directions to build a barometer out of a narrow necked bottle, a glass, and some water. Using their barometer, teams...
It's About Time
Newton's Law of Universal Gravitation
While science is looking for correct explanations, pseudoscience often fills in the blanks. Pupils explore the relationship between light distance and intensity and graph their data. Then they compare their data to Newton's Law of...
American Statistical Association
The Taste of Yellow
Does lemonade taste better when yellow? A tasty experiment has scholars determine the answer to the question. It requires conducting a taste test with lemonades of different colors (from food coloring), and then collecting and analyzing...
American Institute of Physics
The Tuskegee Weathermen: African-American Meteorologists during World War II
Chances are good that young scholars have heard of the Tuskegee Airmen but few would predict that these pilots had their own support in the form of the Tuskegee Weathermen. These Black meteorologists were recruited and trained to provide...
LABScI
Population Dynamics: The Predator-Prey Lab
Wolves eat better when the bunny population increases, but how long does that last? A series of 12 biology lessons uses the sixth installment to explore the predator-prey relationship between bunny and wolf populations. Young scientists...
Pingry School
Determination of the Molar Mass of an Unknown Acid
Acids and bases have a love-hate relationship. They balance each other so nicely, but they are complete opposites! Learners use these concepts and titration to calculate the molar mass of an unknown substance. The experiment document...
Energy for Keeps
Renewable Energy Action Project: What's in Your Energy Portfolio?
Uncover the renewable energy potential in your region. The activity outlines an approach to research current practices and trends. Learners conduct surveys to assess the attitudes of the local population and prepare a paper summarizing...
Virginia Department of Education
Attributes of a Rectangular Prism
A change is coming. Pupils use unit cubes to investigate how changes in the length, width, and/or height affects volume and surface area. They extend the results to write and test predictions on the effect of changing multiple sides on...


