Teach Engineering
Linking Sources and Pollutants
Class members use an air quality monitor to measure the amount of gas-phase pollutants emitted by different sources. Groups choose three different sources and make predictions about what the monitors will detect. Teams then expose the...
American Statistical Association
Confidence in Salaries in Petroleum Engineering
Just how confident can we be with statistics calculated from a sample? Learners take this into account as they look at data from a sample of petroleum engineer salaries. They analyze the effect sample size has on a margin of error and...
Inside Mathematics
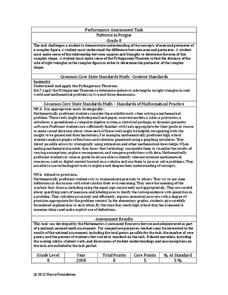
Patterns in Prague
Designers in Prague are not diagonally challenged. The mini-assessment provides a complex pattern made from blocks. Individuals use the pattern to find the area and perimeter of the design. To find the perimeter, they use the Pythagorean...
Radford University
How Normal Are You?
It's completely normal to learn about normal distributions. An engaging lesson has young statisticians collect and analyze data about their classmates as well as players on the school's football team. They determine whether each set of...
Noyce Foundation
Sewing
Sew up your unit on operations with decimals using this assessment task. Young mathematicians use given rules to determine the amount of fabric they need to sew a pair of pants. They must also fill in a partially complete bill for...
California Education Partners
Summer Olympics
Quickly get to the decimal point. The last assessment in a nine-part series requires scholars to work with decimals. Pupils compare the race times of several athletes and calculate how much they have improved over time. During the second...
Baylor College
Body Strength
Your young learners will discover how muscular strength and endurance can increase with this truly hands-on activity! Beginning by writing an acrostic for the word strength, class members then engage in tracking their ability to squeeze...
101 Questions
Pokémon Go Cheat
Gotta catch them all—no learner left behind! Young scholars must predict the length of time it takes a phone attached to a fan to travel five kilometers given the radius and rotations versus time data. Why would you attach a phone to a...
Curated OER
Marble Mania
Students explore the concept of probability. In this probability lesson, students develop an understanding of probability by pulling marbles out of a bag and recording the data. Students use the recording sheet to discuss the results of...
Curated OER
Weather Watchers WebQuest
Students explore a variety of weather websites, and complete a Weather WebQuest worksheet. They read and analyze weather data, prepare a weather forecast and daily weather report, and predict the weather for the next two days.
Curated OER
Why is it so hot when I sit next to the window?
Students investigate how energy travels through glass. For this energy usage lesson, students conduct an experiment in which they decide if window film affects how much energy travels through the glass. Students use a journal to make...
Curated OER
Price of Apples- Linear Data
Young scholars collect data and create a graph. In this algebra lesson, students describe functions graphically, algebraically and verbally. They identify functions as being independent and dependent using variables.
Curated OER
How High Are the Clouds?
Learners analyze height and collect data to create a graph. In this statistics lesson, students use central tendencies to analyze their data and make predictions. They apply concept of statistics to other areas of academics to make a...
Curated OER
Chances Are: Talking Probability
Students explore probability and the process of data analysis and predictions. They participate in two activities, one involving a calculator and one the Internet, in which they make predictions and conduct activities to test their...
Curated OER
Ice Cream Lab
I scream, you scream, we all scream for ice cream! Even high schoolers enjoy making ice cream. This laboratory exercise has them record the temperature changes throughout the process of liquid becoming solid, graph the results, and...
Texas Instruments
Finding Linear Models Part III
Explore linear functions! In this Algebra I lesson, mathematicians graph data in a scatter plot and use a graphing calculator to find a linear regression and/or a median-median line. They use the model to make predictions.
Curated OER
Voter Turnout
Explore politics by analyzing the voting process. Pupils discuss the purpose of casting votes in an election, then examine graphs based on the data from a previously held election's turnout. The lesson concludes as they answer study...
Houghton Mifflin Harcourt
Unit 3 Math Vocabulary Cards (Grade 5)
Fifty-four flashcards make up a set to help reinforce math vocabulary. The set offers two types of cards; a word card printed in bold font, and a definition card equipped with an example and labels. Terms include capacity, histogram,...
Curated OER
Sea Turtle Math
Students consider the future of endangered species. In this conservation instructional activity, students view a slide show and use mathematical data to construct a prediction for the survival of an endangered species. This instructional...
Cornell University
Mechanical Properties of Gummy Worms
Learners won't have to squirm when asked the facts after completing an intriguing lab investigation! Hook young scholars on science by challenging them to verify Hooke's Law using a gummy worm. Measuring the length of the worm as they...
Ontario
Sample Guided Reading Lesson for Emergent Readers
Give your guided reading lesson plan a boost with a sample lesson plan designed to reinforce academic content covered in previous assessments. The sample plan describes how the story and activities were chosen and offers the following...
Virginia Department of Education
Passing Traits to Offspring
What makes each one of us unique? Lead your class in this exciting and educational activity as you uncover traits that show how each individual is different from another. Pupils explore facts about DNA technology and predict the...
School District of Palm Beach County
Framed Paragraphs characterization, problem and solution, symbolism, conflict
Support your learners as they work on writing paragraphs by providing graphic organizers, outlines, and frames. Sift through this packet to find the perfect organizers and templates to prepare pupils for writing. The resource...
National Park Service
Aspect, Treeline, and Climate
Head to the treeline and beyond to examine how this feature of the landscape affects weather and climate, which gives scientists clues about its health. Class members' observations of photographs provide the data that drives the...


