Curated OER
Comparing Countries
Students compare facts about different countries. In this comparing lesson, students collect information about the US and another country and compare them. Students locate countries on the map and make a hypothesis about the lives of...
Curated OER
What's Russia To Do?
Students watch a PowerPoint presentation on the Gulag system in Russia. In groups, they use the internet to create maps on climate and population pyramids for the country of Russia. They must use this information and develop a plan to...
Curated OER
Conditions at Sea Introductory Activity, Making Waves
Students explore waves and wind. In this physical and earth science wave instructional activity, students participate in a wave making activity with an aquarium and a hair dryer. Students complete a data chart recording wave height and...
Curated OER
Trends Forecasting
Students practice trends forecasting to predict the weather. In this forecasting lesson plan, students learn how meteorologists predict the weather by looking at weather trends. They then predict their own forecast, analyze the results,...
Curated OER
How Probable is It?
Students explore probability. In this probability lesson, students look at videos and websites where they discover probability facts that can be used in situations. They determine the probability of different events.
Curated OER
What is the Best Chip?
Scholars collect data about chips. They pick their favorite type of chip from a given variety such as potato chips, tortilla, or banana chips. Then they write on an index card their favorite chip and why it's their favorite. They also...
NOAA
Into the Deep
Take young scientists into the depths of the world's ocean with the second activity of this three-part earth science series. After first drawing pictures representing how they imagine the bottom of the ocean to appear, students...
University of Colorado
The Moons of Jupiter
Can you name the three planets with rings in our solar system? Everyone knows Saturn, many know Uranus, but most people are surprised to learn that Jupiter also has a ring. The third in a series of six teaches pupils what is around...
Columbus City Schools
Totally Tides
Surf's up, big kahunas! How do surfers know when the big waves will appear? They use science! Over the course of five days, dive in to the inner workings of tidal waves and learn to predict sea levels with the moon as your guide.
EngageNY
Tax, Commissions, Fees, and Other Real-World Percent Problems
Pupils work several real-world problems that use percents in the 11th portion of a 20-part series. The problems contain percents involved with taxes, commissions, discounts, tips, fees, and interest. Scholars use the equations formed for...
Ohio Literacy Resource Center
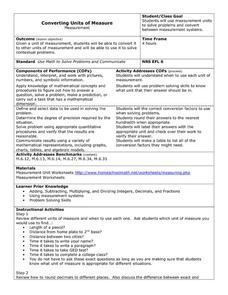
Converting Units of Measure
Follow six steps to implement this series of metric worksheets. Here, mathematicians exhibit their knowledge of problem solving, while converting units of measurement and label their answers with the applicable unit name.
EngageNY
Sampling Variability in the Sample Proportion (part 2)
Increase your sample and increase your accuracy! Scholars complete an activity that compares sample size to variability in results. Learners realize that the greater the sample size, the smaller the range in the distribution of sample...
Howard Hughes Medical Institute
Color Variation Over Time in Rock Pocket Mouse Populations
While many mutations are neutral, those that appear advantageous increase in frequency in a population. Scholars use illustrations to make predictions about populations of mice. They follow it up with a video to confirm or refute their...
Curated OER
Oh, What A Day
Students listen as the teacher reads A Country Far Away. They predict what they will do and what they think their partner student will be doing. Students create a KWL chart for Japan. They collect information about their activities on an...
Curated OER
Jellybean Graphs
Second graders predict and graph data based on the color of jelly beans they think are in a handful. In this prediction lesson plan, 2nd graders will predict how many of each color jellybean are in a handful. Then they graph these...
Curated OER
Weaving Weather Maps with the World Wide Web
Learners access the Internet and use real time data from the American Meteorological Society to create a detailed weather map. They make weather predictions based on the data collected.
Curated OER
Plotting Data on a Graph
Young scholars investigate graphing. For this graphing lesson, students survey the class and create graphs to reflect the data collected.
Curated OER
The Human Line Plot
Fifth graders collect data and use charts and line plots to graph data. Through class surveys, 5th graders collect data concerning a particular subject. They graph their data using a line graph. Students make inferences and predictions...
Curated OER
Peat Pots
Students place a peat pot in water to observe and calculate the rate of capillarity in a model of a soil. This task assesses students' abilities to make simple observations, collect, record, and represent data, use a data table to...
Curated OER
Getting A Grip On Graphs
Fourth graders gather variety of data and create a graphs to display the data.
Curated OER
The Foot Book
Students use estimation and measurement skills to make predictions and solve problems about length. They also analyze data presented to calculate ratios and percents.
Curated OER
Calculating Buttons
Students, after reading "The Button Box" by Margarette S. Reid, analyze real-world data by surveying a sample space. They predict the generalization onto a larger population utilizing calculators and computers. Students total categories,...
Curated OER
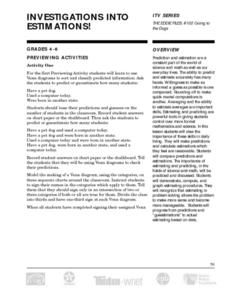
Investigations into Estimations
Students gain the powerful tools of estimation, prediction, and averaging and discover the importance these tools have in daily living.
Curated OER
Our Favorites
Students participate in and conduct a survey to determine various class favorites. They collect, organize and display their data, interpret the results, and complete a packet of worksheets to display the information.


