Curated OER
Math:Survey Role-Playing Activity
Learners create survey questions to discover why students join clubs. Using sampling methods and question phrasing techniques, they conduct the survey both in and out of school. Once learners analyze their survey information, they...
Curated OER
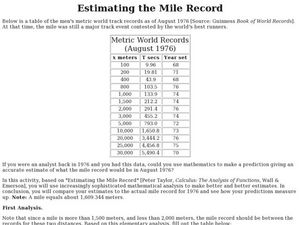
Estimating the Mile Record
In this estimating the mile record, students examine given data. They use create a box-and-whisker plot to determine the upper and lower quartiles of the data. This one-page activity contains 1 multi-step problems.
Curated OER
Pop Clock
Pupils review the Census Bureau's Homepage, gather information regarding population trends in order to make predictions on future populations.
Curated OER
Linear Patterns in Data
Eighth graders extend their learning of graphing linear equations and are introduced to connecting patterns in tables and graphs to represent algebraic representations. They then determine patterns and extrapolate information from these...
Curated OER
Real Estate Lesson: Monthly Payments
Pupils examine real-world data relating to real estate. They conduct Internet research, record data regarding real estate in major cities, graph the data, calculate mortgage payments using a mortgage calculator, and analyze the data.
Curated OER
Impact!!
Students perform a science experiment. In this algebra lesson, students collect data from their experiment and create a graph. They analyze the graph and draw conclusion.
Curated OER
Lines of Fit
Students graph an equation and analyze the data. In this algebra lesson, students graph scatter plots and identify the line of best fit using positive correlation, negative correlation an d no correlation. They apply their data analysis...
Curated OER
Exploration Sequence of Bounces
New skills are developed as students use graphing calculators and ranger technology to capture and graph the sequence of bounces a ball makes when dropped. After recording the height of four or more bounces, they use the collected data...
Curated OER
Global Warming Statistics
Learners research and collect data regarding temperature changes for a specific location and find the mean, median, and mode for their data. In this climate change lesson plan, students choose a location to research and collect data...
Curated OER
Weather "Whys" : Introduction to Weather
Students discuss weather forecasts and different types of weather. In this weather instructional activity, students observe the weather and learn a weather song. They listen to a story and see weather measurement tools.
Curated OER
Shop 'Til You Drop
Students evaluate food prices. In this real world math lesson plan, students compare the cost of various grocery items to determine which is the best deal. They work in groups using grocery ads to decide how to get the most product for...
Curated OER
Graphing Weather
Students make a graph. In this weather lesson plan, students fill in a KWL chart about different types of weather. Students watch a PowerPoint presentation about weather and natural disasters and where these types of weather are common....
Curated OER
What Are We Going To Do About Baby Six Billion?
Students formulate and evaluate suggestions about government policy using demographic examples and projections. They examine websites and utilize worksheets imbedded in this plan.
Curated OER
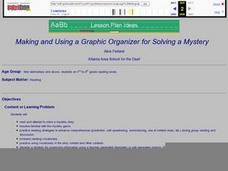
Making and Using a Graphic Organizer for Solving a Mystery
Students create tables in a word processing program which helps them organize their text clues when reading a mystery story. They develop reading comprehension strategies while using a computer based graphic organizer in order to solve...
Curated OER
Introduction to Density
Seventh graders discover the definition of density through a demonstration using ethanol and ice cubes and a class discussion using a SMART Board to illustrate formulas and calculations. Students finish the lesson by practicing...
Curated OER
Track's Slippery Slope
Middle schoolers graph data of sports figure running time using x-axis y-axis to find slope of trend line, mathematically find the interpolated and extrapolated values for data points. Using the information they make predictions.
Curated OER
Green Leaves
Third graders, after having conducted one experiment three times, record their observations results in a chart. They predict what hidden colors they believe that a leaf holds. Students record their predictions in their science note books...
Curated OER
Confusing Colors!
Fourth graders collect data, graph their data, and then make predictions based upon their findings. They's interest is maintained by the interesting way the data is collected. The data collection experiment is from the psychology work of...
Curated OER
High Exposure
Students interpret data they receive from the media, discuss possible misinterpretation of data from the media and correctly respond to the misconception quiz question.
Curated OER
Friction and Inertia
Pupils study friction and inertia, make predictions, and compare data. In this investigative lesson students view a demonstration on friction, divide into groups, and complete an activity.
Curated OER
Bungee M&M's
Eighth graders experiment with M&M's and a cup attached to a spring to to simulate a bungee jump. They graph the results of the experiment and make predictions for continuing the experiment. They determine the "line of best fit."
Pennsylvania Department of Education
Volume and Surface Area
Build boxes using unit cubes to compare surface area and volume. The group performs multiple experiments to determine properties of volume, such as if it makes a difference which order the dimensions are multiplied in. Extensive...
Curated OER
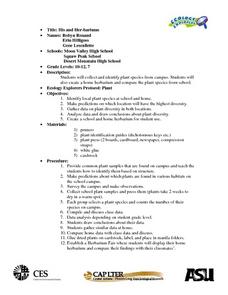
Science: Her-bariums Galore!
Young scholars collect and identify plant species and construct herbariums both at school and at home. By gathering data from both locales, they draw conclusions and make predictions about plant diversity. Upon completion of the...
Curated OER
Unwind: Directed Reading Thinking Activity
To generate interest in reading Neal Shusterman's young adult science fiction novel Unwind, class members engage in a Directed Reading-Thinking Activity (DRTA) that asks them to examine the front and back covers, the blurbs, and "The...


