Curated OER
Dental Detectives
First graders explore the theme of dental health and hygeine. They make tooth loss predictions, count lost teeth, and graph tooth loss. In addition, they listen to dental health stories, read online stories, create spreadsheets, and play...
Curated OER
Volume, Mass, and Weight
Study the difference between mass and weight. Your math group will compare the weight of an item to the amount of space that it uses. They'll then use conversion factors to find the difference between kilograms and pounds. Essential...
Curated OER
Taking Its Toll
Young scholars explore ratios. For this rates lesson plan, students create a ratio to compare the price of a toll to the distance travelled. They compute the average cost per mile, determine the slope between two ordered pairs, and make...
Curated OER
Conversation Heart Graphing
Sixth graders review the different types of graphs (bar, line, pictograph) They predict the data set they can garner several boxes of conversation hearts. Students record their data using an Excel spreadsheet. They create a graph based...
Howard Hughes Medical Institute
Natural Selection and the Evolution of Darwin's Finches
Darwin explained the connection between species of finches 150 years before scientists understood DNA. Technology and progressing science proved he was right, yet many struggle to understand how natural selection happens. Scholars use...
Google
Surveys and Estimating Large Quantities
Looking for an estimation activity a bit more involved than the typical "guess the number of jellybeans in the jar" game? Here, learners use a picture to estimate the number of people at a large event, look for potential problems with...
Curated OER
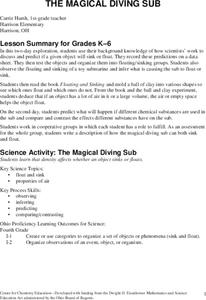
The Magical Diving Sub
First graders discuss and predict if a given object sinks or floats. They record their predictions on a data sheet. Pupils test the objects and organize them into floating/sinking groups. Students observe the floating and sinking of a...
Curated OER
Understanding Weather and Climate Patterns
Students research the climate patterns of various locations and make predictions based on their findings. They determine the importance of latitude and longitude in weather and climate. Students create graphs displaying their collected...
Curated OER
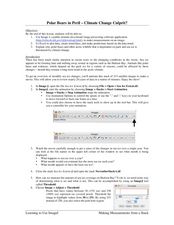
Polar Bears in Peril - Climate Change Culprit?
Learners explore the changes in sea ice over several years. In this life science lesson, students review and examine 20 years of data. They use Excel to graph data and analyze trends.
Curated OER
US Households
Learners construct and use inverse functions to model a real-world context. They use the inverse function to interpolate a data point.
Curated OER
US Population 1982-1988
Your algebra learners make predictions using the concepts of a linear model from real-life data given in table form. Learners analyze and discuss solutions without having to write a linear equation.
Noyce Foundation
Time to Get Clean
It's assessment time! Determine your young mathematicians' understanding of elapsed time with this brief, five-question quiz.
Curated OER
Weather Lesson Five
Students define a weather forecast, make a forecast using a weather map, identify three prediction guidelines, and explain how computers help to make forecasts. Students make a 24-hour forecast for each of the thirteen states targeted.
Curated OER
Pen Pals
Young scholars make their own predictions about the amount of different types of birds at each site before they go there. In groups, they collect the bird data and compose letters to their pen pals sharing their information. To end the...
Utah Education Network (UEN)
The Human Line Plot
Learners collect data and use charts and line plots to graph the data. Some excellent worksheets and activities are embedded in this fine lesson plan on line plots.
Curated OER
Folds in the Earth
Ninth graders demonstrate the forces that cause folds in the earths crust by use of clay modeling. They demonstrate there knowledge of terminology and concepts related to Earths folding processes by a written or oral report on data...
Curated OER
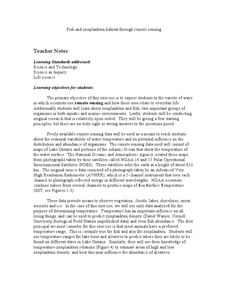
Fish and Zooplankton Through Remote Sensing
Ecology aces examine sea surface temperature maps and relate temperatures to concentration in fish and zooplankton populations. Take your class to a computer lab and provide experience with actual remote sensing data. Some of the links...
Curated OER
Shaquille O'Neal Hand/Foot Span: Student Worksheet
Here's a clever math worksheet that has learners measure their hand span, foot length, come up with a ration, then use that information to figure out the hand span, and foot length of basketball giant Shaquille O'Neal. A good activity!
Curated OER
Missing Macroinvertebrates - Stream Side Science
Field study groups collect samples of stream water and identify the macroinvertebrates found. Using their data, they calculate a water quality index to rate the health of the stream. They graph their data and discuss the value of a water...
Curated OER
What's in the Water? - Stream Side Science
Here is a complete activity in which young biologists or ecologists test the pH, dissolved oxygen, turbidity and temperature of stream water. The class visits an actual stream and makes observations of the site. They use scientific...
Curated OER
Just Me and My Shadow
Young scholars take measurements throughout the day using a simple sundial called a gnomon. They record the results on a Data Log and convert from English units to metric (S.I.) units. Data points are plotted on the same graph and analyzed.
Curated OER
Homemade Rocks
Student make at least FIVE rocks. They write predictions about that will change and occur. Each student receives a small cup that they label with their name to hold their rocks.
Curated OER
How Far Can You Jump?
Students estimate the distance of student's broad jumps. This activity can take place in the block center with a small group of students. They are explained that they are going to jump from a starting point (marked with the masking...
Kent State University
How Does that Work?
Sixth and seventh graders explore algebra word problems. They work with a partner to solve word problems distributed by e-mail. Learners simplify mathematical expressions following a "think aloud" algebra strategy modeled by the teacher....


