It's About Time
Volcanic Hazards: Airborne Debris
Pupils interpret maps and graph data related to volcanic ash. Then they analyze the importance of wind speed and the dangers of the ash to both life, air temperature, and technology.
Curated OER
The Effects of Temperature on Rate
Students create predictions on what they believe happen to reaction rates when temperature is raised. They use hot, cold, and room temperature water for this experiment and observe the differences. They graph their observations and...
Curated OER
The Parachute
Students discuss parachutes and write a procedure to determine the effect of different size parachutes and different masses on the time it takes the masses to fall. They record all their data from their experiment then write three...
Curated OER
Climate Change in My City
Students investigate the climate changes occurring locally, regionally and globally over the last one hundred years. They brainstorm and predict whether the current year's weather was warmer or colder than last year then check the...
American Statistical Association
What is the Probability of “Pigging Out”
Learners apply their understanding of luck to a probability experiment. They play a game of Pass the Pigs to determine the probability of a specific outcome. Using analysis for their data, pupils declare the measures of center, dot...
Curated OER
Buying on Credit
Explore using credit in this financial responsibility and math lesson. Learn to identify the acronym of "PRT" as Principle x Rate x Time, then calculate interest based on this formula. Do some real-world problem solving and choose...
Curated OER
Rain and Lightning
What are the chances that there will be rain and lighting today? Use this activity to study independent and dependent probabilities with your class. Learners explore the differences between P(A and B) and P(A or B) using mock weather...
Mathematics Vision Project
Module 4: Linear and Exponential Functions
Sequences and series are traditionally thought of as topics for the pre-calculus or calculus class, when learners are figuring out how to develop limits. But this unit uses patterns and slopes of linear functions in unique ways to bring...
Curated OER
National Longitudinal Survey of Children and Youth (NLSCY)
Students review data analysis techniques. In this statistics lesson, students access statistical software regarding the National Longitudinal Survey of Children and Youth. Students read and interpret the data as they complete the...
Curated OER
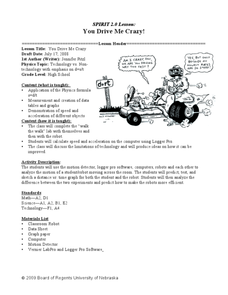
You Drive Me crazy
Students calculate the distance and acceleration of an object. In this algebra lesson, students collect data and create table and graphs to analyze it. They complete a lab as they collect and analyze data on acceleration and distance.
Curated OER
Thirst Dilemma (Drinking in the Desert)
Ninth graders explore linear functions. In this Algebra I lesson, 9th graders collect and analyze date as they investigate the question of how long will water last if you are trapped in a desert. Students create scatterplots of their...
Curated OER
Science and Technology
Students research inventions that have been created. In this historical technology lesson, students read the Harcourt Brace social studies textbook and discuss how inventors used graphs to display data. Students create a table to write...
Curated OER
WEATHER SATELLITE PREDICTION PROJECT
High schoolers compile weather satellite data from three satellites for one month, obtain weather reports and data from professionals, then create a document with predicted results.
Curated OER
The Bio-fuel Project: Creating Bio-diesel
Students investigate bio-fuel. In this investigative lesson, students create bio-fuel from vegetable oil waste. Students will analyze, predict, collect and synthesize data from their experiments with bio-fuel.
Michigan Sea Grant
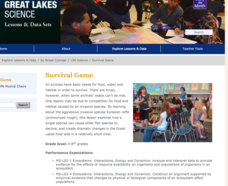
Survival Game
Musical chairs may be a classic game, but Ruffe Musical Chairs is a unique lesson on invasive species! Using the time-honored game, pupils role play the behaviors of the invasive fish called Eurasian ruffe. Learning about this aggressive...
Curated OER
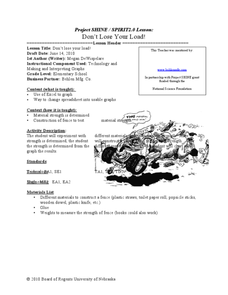
Don't Lose Your Load!
Students create graphs using collected data. In this algebra lesson plan, students use spreadsheet in Excel to create graphs to interpret their data and make predictions. They rewrite word problems using algebraic expressions.
Curated OER
Leading Economic Indicators
Twelfth graders collect the data of the leading economic indicators over the last six months and create graphs plotting the data. They analyze/evaluate the data collected in order to predict economic trends for the next six month period.
Curated OER
I Wonder How Fast Manduca Grows...
Students create a graph showing the growth of their manduca since it hatched. They make their own predictions about how it will grow. They answer questions to end the lesson plan.
Curated OER
Geometry Jeopardy
Students identify the pattern in a problem. For this geometry lesson, students make predictions, collect and analyze data. They apply the idea of scales and measurements to the real world.
Curated OER
A Lesson in Biodiversity: Making Comparisons Between Defensive Mechanisms Utilized by Marine Organisms
If your upper elementary or middle school marine biology learners are going to visit an aquarium, then here is a field trip activity guide for you. It is written specifically for The Maritime Aquarium, but the idea can be adapted to any...
Curated OER
Investigation 6 - Collecting Weather Data
Fourth graders collect data for two weeks. They start seeing patterns and make predictions. They can predict what the weather be like the next day and for the next few days. They see if their predictions were correct from the previous day.
Curated OER
ng Data: Probability, What's in the bag?
Students use the language associated with probability to discuss events including those with equally likely outcome. They collect data from a simple experiment and record in a frequency table: estimate probabilities based on this data
Curated OER
MAPPING A RESEARCH SITE AND COLLECTING AND PRESENTING POPULATION DATA
Sixth graders are to answer research questions based on data they collect.
Curated OER
Using Active Learning to Reinforce Mathematics
Students predict, then measure how far a bug can travel on a "course" over a specified amount of time, then construct graphs based on the data they acquire.


