Curated OER
Non-Standard Measurement
Learners, using a list made up of things from around the room; estimate the distance of one of the items on the list with one unit, record their prediction, and then actually measure items with non-standard measuring devise.
Curated OER
Global Statistics
Students select appropriate data to determine the mean, median, mode and range of a set of data. They calculate the statistical data on literacy rates and life expectancy within each geographic region of the world. Students determine...
Curated OER
Typhoon Project
Pupils graph and outline the path of a typhoon. In this algebra lesson, students measure the path of the typhoon and create a graph with their data. They analyze the data and make predictions.
Curated OER
Math: Will The Airplane Get Off the Ground?
Students use data from real-life models to calculate and compare the force required for an airplane of a given weight to become airborne. They use a graphing calculator to evaluate data and use the World Wide Web to access data.
Curated OER
Rate of Solution
Eighth graders determine the amount of agitation necessary to dissolve various sized sugar particles. This task assess students' abilities to collect, organize, and interpret data, create appropriate graphs, predict future events based...
Pennsylvania Department of Education
Equally Likely and Unequally Likely Outcomes
Students explore probability. In this statistics/probability lesson, students compare experimental and theoretical probability and use experimental probability to make predictions and conjectures. Students explore the distinction...
Curated OER
Modeling Population Growth
Learners collect data on population growth. In this statistics lesson, students graph their data and make predictions. They find the linear regression and the best fit line.
Curated OER
Political Polls
Students explore politcical polling by conducting a poll of student body elections. They prepare a survey, distribute forms, and tabulate data.
Curated OER
Creating Line Graphs
Students relate data to coordinate graphs and plot points on this graph. They use minimum wage data to construct the graph. Students decide appropriate time intervals for the graphs. They share graphs with their classmates.
Curated OER
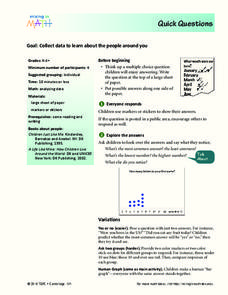
Quick Questions
Students ask their classmates survey questions. In this survey lesson, students come up with a question and possible answers. Their classmates mark their answers and the class discusses what they notice.
Curated OER
Top Quark Lab
Young scholars find the mass of the top quark. In this physics lesson, students create a vector diagram from a given set of data. They discuss their calculations and findings in class.
Curated OER
Applied Science - Science and Math Lab
Although it was written to use in a science class, this measurement lesson is adaptable to Common Core standards in math for measurement and data. Youngsters are introduced to two types of measurement systems. They use both the English...
Curated OER
Whirlybirds
Students measure to the nearest centimeter, and predict the frequency of an event. In this statistics lesson, students participate in a simulation of a parachute jump competition by making paper Whirlybirds, and then dropping them...
Curated OER
Avalanche!
Students build a model representing a snow-covered mountain out of flour, sugar, and potato flakes. Then they use the model to recreate an avalanche.
Curated OER
Hot Rocks
Learners demonstrate that setting of plaster and cement is a change, which involves a release of heat energy, use data collected experimentally to construct comparison graphs and analyze the graphs to make predictions about future...
Curated OER
HYPOTHESIZE THIS!
Students predict, measure, collect, and analyze data to investigate heat loss in water and in air.
Curated OER
The Water Cycle and Global Warming
Students study the flow of water in the environment. In this water cycle lesson students evaluate the consequences of changes in the water cycle using data.
Curated OER
Computation with Fractions
Upper graders are introduced to the topic of fractions and percentages. In groups, they discuss real world situations in which fractions are present, and they complete a worksheet solving problems with common and uncommon denominators....
Curated OER
Heat Loss
Students comprehend how heat loss is affected by exposed surface area. They decide what type of and how many data to
collect. Students decide how the results should be presented. They make a series of accurate observations
Curated OER
Code Breakers
Students collect data and make a frequency table, change ratios into percents, and analyze data to make predictions.
Curated OER
What Makes Up a Healthy Watershed
Students, after observing the elements of a local watershed, explore the need to protect watersheds as water resources for the future. They examine the factors involved with a watershed: geology, ecology, and the effect of man's...
Curated OER
From Trees to Paper
Sixth graders investigate logging and the process of paper making. In this forestry lesson, 6th graders analyze pictures of trees being processed into the paper they use everyday. Students solve and create math problems based on...
Curated OER
Is the Hudson River Too Salty to Drink?
Students explore reasons for varied salinity in bodies of water. In this geographical inquiry lesson, students use a variety of visual and written information including maps, data tables, and graphs, to form a hypothesis as to why the...
Curated OER
Using Ratios to Taste the Rainbow
Students solve problems using ratios and proportion. In this algebra lesson, students analyze skittles and their different colors as they apply the properties of ratios and proportions to solve their problems.


