Curated OER
Usage and Interpretation of Graphs
Students explore graphing. In this graphing lesson, students predict how many shoe eyelets are present in the classroom. Students count eyelets and work in groups to organize and chart the data collected. Students put all the data...
Curated OER
Cars on the Curve
Second graders, using two dice, participate in a car race game called Cars on the Curve. They predict which car wins the game and records it in their Data Diary.
Curated OER
Poetic Math Greeting Cards
Fourth graders work in groups; collect data in a survey; depict in tables, charts, or graphs the results of the survey; and make predictions. They use creative writing skills and computer skills to generate a greeting card of their own.
Curated OER
Conceptualizing an Experiment
Students work together to design an experiment. They discover the origin of a family artifact. They analyze the data and discuss the results. They determine if the experiment is the best way to find out this type of information.
Curated OER
Parachute Drop
Students explore the effects of gravity. They create a parachute and make predictions about the effect of adding weight to the bottom of the parachute. Students record and interpret results of parachute experiments.
Curated OER
Graphics Creation and Statistical Interpretation: Relating Local Economics and the Global Environment
Students apply statistics, and graphical interpretation to economics, the environment and populations. In this statistical lesson plan students construct graphical displays and classify data.
Curated OER
Build a Skittles Graph
Students construct a bar graph with a given set of data. They calculate the ratio and percent of the data. Students discuss alternate ways of graphing the data as well as multiple strategies to approach the task.
Curated OER
Graphing Sea Ice Extent in the Arctic and Antarctic
Students graph sea ice data and predict long term trends in the data. In this climate change lesson, students use sea ice data from the Arctic and Antarctic to construct line graphs. They use their graphs to predict the effects of global...
Curated OER
Operation Weather Station
Students work in cooperative groups to create a working weather station. Tkey use the weather station to collect weather data over a one-week period. Students compare the data from their weather station to actual weather information...
Curated OER
Which Car Should I Buy?
Students use gas mileage of different cars to create T charts, algebraic equations, and graphs to show which gets better mileage. In this gas mileage lesson plan, students use the graph to see which car they should buy.
Curated OER
A Plane Old Time
Fourth graders become familiar with a chart and use the information to create a flight plan. In this flight plan lesson plan, 4th graders access background knowledge of the role of flight controllers and the number concepts they use. ...
Curated OER
Mean, Median, and Mode
Students find the mean, median, and mode for a set of data. They define terms and find examples, as well as complete practice exercises. They work cooperatively to analyze real data from a variety of websites provided. To...
Curated OER
Acceleration 1
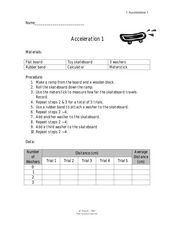
In this acceleration worksheet, students use weights to increase the mass affecting the force on moving objects. Students plot a graph of their data and answer 3 questions about how the acceleration of the toy skateboard used in the...
Curated OER
Fizzy Pop
Fifth graders compare and identify variables that affect the rate of a chemical change using Alka-Seltzer, water, ice, and hot water. They time how long each variable takes to pop the canister into the air, and record the results on a...
Curated OER
Mystery Spill
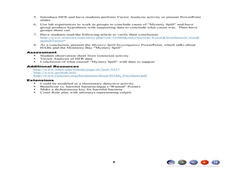
Students investigate the cause of birds dying in Monterey Bay. In this scientific research lesson, students use various resources, scientific investigations, and vector analysis to solve an environmental mystery.
Michigan Sea Grant
Food Web II
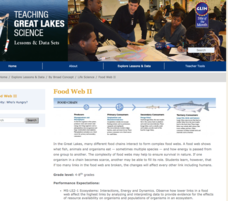
A food web consists of complex food chains and the more complex the web, the better likelihood of survival. Learners compare and contrast food webs and food chains and discuss concepts like the predator-prey and consumer-producer...
Curated OER
Dripping Wet or Dry as a Bone?
Students use a sponge and water model to explore the concept of relative humidity and create a percent scale. They define humidity and saturation, build a simple humidity/saturation model, collect, predict and interpret data, and create...
Discovery Education
It's Too Loud!
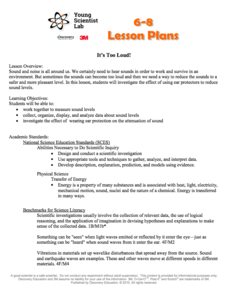
STEM scholars investigate sound attenuation by conducting an experiment in which they compare the farthest distance that they can hear a sound with and without ear protection.
Curated OER
Mixtures
Students observe that movement of a solute in the solvent increases the rate of dissolution. They demonstrate that when the solute is broken into smaller pieces it dissolves faster.
Curated OER
M & M Madness
Second graders graph M & M's by color. In this graphing lesson plan, 2nd graders first predict how many of each color they think are in a handful of M & M's. Then they graph the amounts of each color on a computer program....
Curated OER
Creeping
Young scholars observe, measure, and graph a model of slow down slope movement representing soil creep. This task assesses students' abilities to collect, record, and organize data, set up graph axes, plot data points, draw line graphs,...
Curated OER
Chew on This
Eighth graders explore and demonstrate the seven steps of the scientific method. They predict how much sugar is in chewing gum and test, analyze, and calculate the sugar content of gum.
Curated OER
Famous Mathematicians/Database
Students analyze a math database and uncover facts. For this algebra lesson, students investigate the lives of famous mathematicians using facts they find about the different authors. They gain a new perspective for the mathematicians...
Curated OER
The Probability Scale
Young scholars collect data and make predictions. For this probability lesson, students perform experiments calculating the chance of an event occurring. They draw conclusion based on their data.


