Curated OER
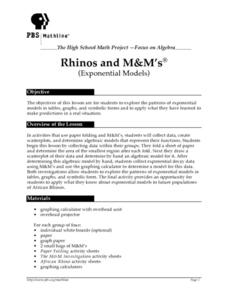
Rhinos and M&M's
Students analyze patterns of exponential models by collecting data in paper folding and M&M investigations. They use graphing calculators to create scatter plots that lead to equations for the exponential models. They then apply this...
Curated OER
Solar Flares and Coronal Mass Ejections
In this solar flares and coronal mass ejections activity, students create a Venn Diagram with given data about solar flares and Halo CMEs. Students answer 6 questions about the events and the probability of each type of event occurring...
Curated OER
Extraordinary Extrapolation
Students study how scientists have estimated the maximum height to which trees can grow, and assess the reliability of interpolation and extrapolation techniques by making predictions with particular data sets and analyzing accuracy of...
Curated OER
SUNSPOTS SPOTTED
Students study sunspots and their motion, from data gathered, they determine the significance of the sunspot data. The data be used to calculate the rotational period of the sun. They draw conclusions as to the sunspot's impact on the...
Curated OER
Density Derby
Students explore the relationship between mass, volume and density. They use model boats to discover how changing mass and volume affect density. This is a very engaging lesson which provides great demonstrations and hands-on activities.
Curated OER
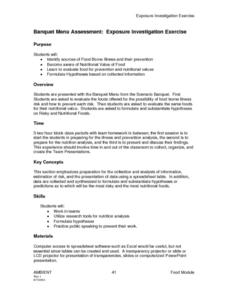
Banquet Menu Assessment: Exposure Investigation Exercise
Learners identify sources of Food Borne illness and their prevention. They formulate hypotheses based on collected information. Pupils become aware of Nutrintional value of food. Students collected data are synthesized to formulate...
Curated OER
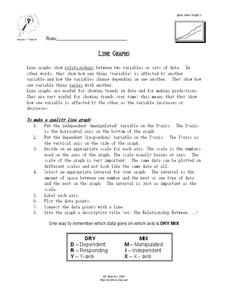
Line Graphs
In this algebra worksheet, students describe the relationship between a line graph and its data. They define the reasons line graphs are used and discuss increasing and decreasing lines. There is one involved questions, requiring several...
Curated OER
Decisions, Decisions, Decisions
Students examine graphs to find the most appropriate for various kinds of data. In this graphing instructional activity, student create bar, line and circle graphs. Students create graphs electronically and manually interpreting the data.
Curated OER
Transformation, Reflections, Rotations and Translations
Students create a quilt, using different patterns. For this geometry lesson, students apply prior knowledge as they use different patterns to help them create a quilt using transformations and geometric shapes.
Curated OER
ELECTRICITY 1
Fifth graders examine the importance of electricity to their everyday lives, practice plotting and interpreting data on a bar graph, and reflect in their journals about how their lives would change without electricity.
Curated OER
Count The Letters
Students perform activities involving ratios, proportions and percents. Given a newspaper article, groups of students count the number of letters in a given area. They use calculators and data collected to construct a pie chart and bar...
Curated OER
Tall Tale Rollers
Students explore American tall tales. In this tall tale lesson, students discover the six characteristics that are included in tall tales. Students survey their class to find each student's favorite tall tale character and organize the...
Curated OER
Box-and-Whisker Plots
Eighth graders measure in feet and inches and convert to explore the relationship between the converted measurements. In this measurement lesson plan, 8th graders use the whisker and box plot to represent the measurement of a cat. ...
Curated OER
Bioinformatics
Learners conduct a series of scientific investigation using bioinformatics. In this molecular biology lesson plan, students collect experimental data using different educational softwares. They calculate and analyze relationships using...
Curated OER
Ready, Set, Go!
Middle schoolers predict if the height of a ramp affect how far an object travels. They design and conduct an experiment to test their predictions. The results are recorded and a graph is created to show the relationship between ramp...
Curated OER
Farming in Space
Students research, design, and run plant growth experiments online. They explore websites, design an experiment using an animation-based building block program, construct a soda bottle hydroponic production unit and a cardboard plant...
Curated OER
Feeling the Heat
Students investigate the urban heat island effect. In this urban heat island effect lesson, students learn how trees, grass, asphalt, and other things on the school grounds effect temperature. They use the information to generalize it to...
Curated OER
Climate Change
Students compare weather data and draw conclusions. In this climate change lesson plan, students determine whether data collected over a period of ninety years shows a warming trend.
Pennsylvania Department of Education
Equal Groups
Students explore statistics by completing a graphing activity. In this data analysis lesson, students define a list of mathematical vocabulary terms before unpacking a box of raisins. Students utilize the raisins to plot data on a line...
Curated OER
Lemonade for Sale
Third graders engage in a read-aloud of the book, "Lemonade for Sale." They collect data from the story and turn the data into a mathematical graph. This lesson has a rubric for you and the students to follow-very creative lesson.
Curated OER
Mapping The Ocean Floor
Young scholars explore and analyze the bottom structure of underwater habitats. They describe and explain what can't see through the collection and correlation of accurate data. Learners assess that technology is utilized as a tool for...
Curated OER
Elders' Weather Forecasting
Students interview an Elder to determine ways of forecasting the weather. For this weather lesson, students use the information from an interview to make a weather prediction.
Curated OER
How Oceans Affect Climate
Learners draw conclusions about how the ocean affects temperature. In this weather lesson, students use the Internet to gather data to help them come to a conclusion about how the climate in a certain region is directly affected by the...
Curated OER
Frost Depth
Learners explore the concept of frost depth. In this frost depth lesson, students conduct a scientific investigation that requires them to use a frost tube to measure, record, and graph frost depth data.


