Curated OER
Forces of Flight - Lift
Students design and test paper airplanes to understand the concept of lift and how it affects flight. This technology-based Science lesson is excellent for use with upper-elementary and middle-level learners and uses spreadsheet software...
National Security Agency
Are You Game? A Lesson Connecting Fractions and Probability
Exactly how fair are the board games children grow up playing? Young mathematicians investigate this questions as they work their way through this five-lesson series on basic probability.
Curated OER
Walk-A-Thon
Students graph linear http://www.lessonplanet.com/review?id=180542equations. In this problem solving lesson, students calculate slope and plot ordered pairs on a coordinate grid. Using a real-life example of a walk-a-thon, students...
Wisconsin Online Resource Center
Oversized Inch
Each member of the class creates their own paper ruler. Using their ruler, kids walk around the room measuring the objects you've specified. Discuss how items should be measured to the 16th of an inch, the smallest unit on their ruler....
Curated OER
Sentence Completion 10: Low-Advanced SAT Level
Commiserated, cogitated, ameliorated? Whether used as test prep or as part of a vocabulary study, the problems on this sentence completion worksheet will challenge your learners. Provide them with the detailed answer key and groups can...
Curated OER
Bouncing off the Walls
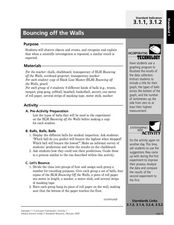
Third graders compare the bouncing height of different types of balls. In this science lesson, 3rd graders explain the importance of repeated experimentation in science. They record their result and share them with the class.
Curated OER
Scatterplot
For this scatterplot worksheet, 9th graders solve and complete 7 different problems that include defining various scatterplots. First, they use the data plotted on the scatterplot that represent the best prediction. Then, students use...
Curated OER
Weather "Whys" Lesson 2 Seasons
Young scholars explore seasons. In this cross curriculum weather and seasons lesson plan, students identify characteristics of the four seasons and sequence related pictures. Young scholars listen to poems and stories about trees in...
Curated OER
The Five Senses
Study various objects and help kindergarteners use their five senses to classify the objects. They are presented with various objects and then use their five senses to sort and classify the objects. Then they use a Visual Ranking Tool to...
Curated OER
Keeping Warm
Fifth graders measure the temperature of water using a thermometer. They record the temperatures of water on a chart. Students use the temperature data to determine which materials are the best conductors of heat. They discuss their...
Curated OER
High School Mathematics Problems from Alaska: Fire Fighting Crew
High schoolers apply mean, median and mode calculations of firefighter test scores to decide on hiring.
Curated OER
Feeling Crabby?
Pupils analyze data to investigate the influence of water depth on size among deep-water crabs. They interpret results from this data, and apply the results regarding appropriate fishery regulations.
Curated OER
Pea Brain! Explorations in Estimation
Young scholars estimate how many peas fit in a container. In this science lesson, students calculate the weight of a pea and record it. They use this data to calculate how many peas fit in a human brain.
Curated OER
Investigating the Probability
Students investigate probability using coins and dice. They collect data, graph, organize and interpret data. They predict, describe, compare, compute and draw conclusions based on what they observe and record.
Curated OER
Equation of a Line
In this equation of a line worksheet, 9th graders solve and complete 4 different multiple choice problems. First, they use the median fit method to determine the equation that most likely represents the line of best fit for the data...
Curated OER
Investigating the Shapes of Covalent Molecules and Measuring their Respective Bond Lengths and Bond Angles
High schoolers will draw Lewis structures of common covalent compounds using a Chem 3D computer program. They will predict the shapes of the molecules, complete a data table, and formulate rules for predicting shapes of molecules. In the...
Curated OER
Of Tides and Time
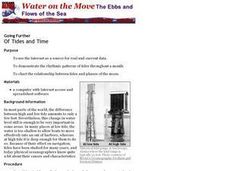
Students use the internet to research how the time of day affects the tides. They work together to develop a demonstration of the tide patterns for a month. They create a chart showing the relationship between tides and the phases of...
Curated OER
Watts Up Doc?
Students examine the wattage of a light bulb using math. In this algebra lesson, students find the inverse square of given parameter. They work in groups collecting and analyzing data.
Curated OER
Pumpkin Seed Experiment
In this unique lesson students participate in a pumpkin seed experiment. Students interact with the pumpkins weight, seeds and record their findings of what lies within the pumpkin once the top of the pumpkin is cut off for observations....
Curated OER
Spreadsheets and Database in Social Studies
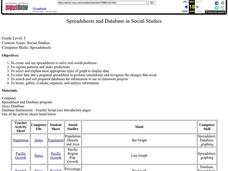
Fifth graders create/use spreadsheets to solve real-world problems, explore patterns and make predictions, select/explain most appropriate types of graph to display data, and enter data into a prepared spreadsheet to perform calculations.
Curated OER
Changes in Pulse Rate
Eighth graders practice making observations and collecting data after determining a baseline pulse rate then collect data on the changes in that rate with exercise. Students must organize their data and analyze their observations.
Curated OER
Measuring Wind Speed
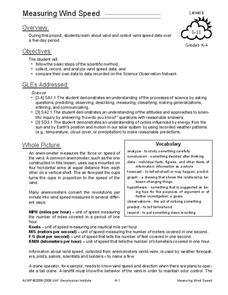
Young scholars study wind speed and collect wind speed data. In this wind speed lesson, students visit a website to learn about the local wind speed forecast for their week. Young scholars discuss wind and wind speed. Students collect...
Curated OER
Don't Let Parabolas Throw You
Learners identify relation, function, patterns and range. In this algebra instructional activity, students factor and graph quadratic equations. They use transformation to move the parabola around and make predictions.
Curated OER
Choosing the Best Graph
Eighth graders produce and examine two sets of data and create what they believe to be the most appropriate graphs to represent these sets of data. After completing the pre-assessment, they discuss reasons for using each type of graph...


