Curated OER
Cost analysis
For this Algebra I worksheet, 9th graders analyze a problem in which basic assumptions must be made about cost and demand for the product or item. Students use a graph to make predictions and determine the best price at which to sell an...
Curated OER
All About Graphs
Students practice organizing data by creating graphs. In this statistics lesson, students survey the class about favorite colors and create a bar graph using the data. Students complete a test based on pet and animal statistics.
Curated OER
Using Maps to Make Public Health Descisions Case Study: Harmful Algal Blooms in the Gulf of Mexico
Students are introduced to GIS and its uses. Students participate as public health scientists to deliberate a course of action to explore possible research questions. Pupils interpret spatial data, and make predictions based on GIS data,...
Curated OER
Fast Talker - Ch 2 project
Tongue Twisters?! Create scatter plot graphs based on timing fellow classmates saying tongue twisters. Then investigate, display, and analyze the relationships based on functions. Wrap up this activity by making a poster or other...
Radford University
Sleep and Teen Obesity: Is there a Correlation?
Does the number of calories you eat affect the total time you sleep? Young mathematicians tackle this question by collecting their own data and making comparisons between others in the class through building scatter plots and regression...
Center for Learning in Action
Water – Changing States (Part 2)
Here is part two of a two-part instructional activity in which scholars investigate the changing states of water—liquid, solid, and gas—and how energy from heat changes its molecules. With grand conversation, two demonstrations, and one...
Science 4 Inquiry
At the Top: A Bald Eagle's Diet
Bald eagles are opportunistic predators and eat fish as well as raccoons and other mammals. Pupils learn about bald eagle diets through a simple simulation and videos. They collect and analyze data to understand the adaptability of this...
Curated OER
The Scientific Method, Blood Typing, and Antibiotic Resistance
Students are given some components of an experiment, where they are able to identify and fill in missing parts, such as hypothesis, conclusion, results, etc. They form a hypothesis given general scientific facts. Students apply the...
Curated OER
Assignment #4 Time Capsule-Your Future
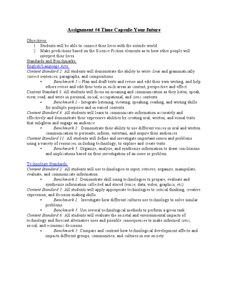
Class members create a PowerPoint presentation showing artifacts they would include in a time capsule. The artifacts and explanations reflect personal hobbies, grooming choices, school life, etc. A great way for class members to...
Curated OER
Line of Best Fit
In this line of best fit worksheet, students solve and complete 8 different problems that include plotting and creating their own lines of best fit on a graph. First, they study the samples at the top and plot the ordered pairs given on...
EngageNY
Linear and Exponential Models—Comparing Growth Rates
Does a linear or exponential model fit the data better? Guide your class through an exploration to answer this question. Pupils create an exponential and linear model for a data set and draw conclusions, based on predictions and the...
Curated OER
Coal Flowers
Let's make coal flowers! With this fun activity, young learners watch and learn as they grow crystals! With simple household materials and the instructions included in this lesson plan, your class can grow their own crystals. Learners...
Beyond Benign
Water Bottle Unit
How much plastic do manufacturers use to create water bottles each year? The class explores the number of water bottles used throughout the years to determine how many consumers will use in the future. Class members compare different...
Curated OER
Matchstick Math: Using Manipulatives to Model Linear, Quadratic, and Exponential Functions
Playing with matches (unlit, of course) becomes an engaging learning experience in this fun instructional unit. Teach pupils how to apply properties of exponential functions to solve problems. They differentiate between quadratic and...
EngageNY
Normal Distributions (part 2)
From z-scores to probability. Learners put together the concepts from the previous lessons to determine the probability of a given range of outcomes. They make predictions and interpret them in the context of the problem.
NASA
The Search for Critical Questions
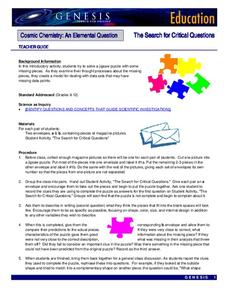
A puzzle isn't about the individual pieces, but how they work together. Scholars assemble a puzzle and discover missing pieces. They write a description of what they expect these pieces to look like, including as many details as...
Curated OER
The Mitten
Explore the Ukraine through a reading of The Mitten. Readers will determine the sequence of events, cause and effect, make predictions, and find the main idea of the story. They also use math skills to make charts and graphs. Finally,...
Curated OER
High School Mathematics Problems from Alaska: Predicting Plant Coverage
Students participate in simulation as they examine vegetation in a square meter land plot. Students construct charts and a key to make predicitons about other land plots.
Curated OER
Weather Predictions
Students record weather data and create a five day forecast. Students investigate the roles of meteorologists and identify symbols used on a weather map. After gathering weather data for a week, students will create a five day forecast...
Curated OER
Predicting the Future
Students examine how scientists predict the effects of global climate change. In this environmental science lesson plan, students participate in a discussion about using computer generated data to create climate predictions. Students...
Curated OER
Prescient Grading
Do homework grades really determine test scores? Learn whether lines of best fit, correlation coefficients, and residuals can be used to determine test scores when given homework grades. (It would certainly save teachers time in grading...
Curated OER
Parachute Drop
Learners will have fun creating a parachute to collect data with. They will construct the parachute in small groups, measure the materials, and create an observation sheet. Then they drop the parachute and make predictions about how long...
Serendip
Understanding and Predicting Changes in Population Size – Exponential and Logistic Population Growth Models vs. Complex Reality
Salmonella poisoning impacts over 200,000 people in the United States each year. Scholars learn about the growth of these bacteria using multiple approaches. Then they apply the same growth calculations to endangered species and think...
Teach Engineering
Earthquakes Living Lab: Finding Epicenters and Measuring Magnitudes
Pairs use an online simulation to determine the epicenter and magnitude of an earthquake. Using real data about the earthquake's maximum S wave amplitudes, they then determine the magnitude. The resource provides a great career...


