EngageNY
Discovering the Topic: Inferring and Confirming Using Evidence
Allow your class to figure out what they will be studying through an inquiry-based anticipatory set that involves analysis of mystery documents and practice with making inferences. The lesson plan document includes a detailed description...
EngageNY
Planning a Historical Fiction Narrative Based on Expert Trades
Pupils plan for a historical fiction narrative based on their previous research on expert trades from the Colonial Era. Individuals use the four-square graphic organizer to organize the information they want to be detailed in their four...
Scholastic
Venn Diagram
Compare and contrast just about anything with this handy graphic organizer. While it is the classic Venn diagram, there's something a little special about this particular resource: it's editable. That means you or your pupils can type in...
Education City
Reading Comprehension
Celebrate National Reading Month in March—or any month of the year—with a selection of versatile graphic organizers. The worksheets prompt readers to compare characters easily, predict what will happen next in a story, track their...
Curated OER
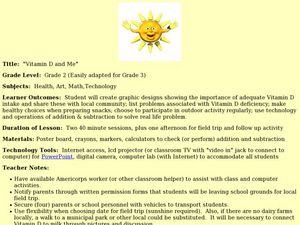
Vitamin D and Me
Students create a graphic organizer showing the importance of Vitamin D intake. In this Vitamin D instructional activity, Students list problems with Vitamin D deficiency and create poster boards in small groups. Individually, students...
San Antonio Independent School District
Political, Economic, and Social Table - The Establishment of the 13 Colonies
Here you'll find a simple graphic organizer that learners can use to categorize the political, economic, and social motivations behind the establishment of the thirteen colonies.
EngageNY
Analyzing Author’s Purpose: Industrial Food Chain
Using an Author’s Purpose anchor chart, groups examine a variety of text to determine the author's purpose. They then apply what they have learned to The Omnivore’s Dilemma. In pairs, they discuss what the text is about and why it was...
EngageNY
Determining Main Ideas and Supporting Details and Summarizing: “Clothing”
Surviving winter. Pupils begin reading on page 18 of The Inuit Thought of It: Amazing Arctic Inventions and sketch how the people used animal skin clothing to survive the winter. Readers complete a main idea graphic organizer with...
Curated OER
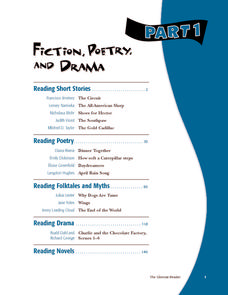
Fiction, Poetry, and Drama Part 1
Similar to a textbook, this resource includes multiple texts, plenty of explanation, lots of practice, and several graphic organizers. Use all of the materials, or pick and choose from such texts as "The Circuit," "Shoes for Hector,"...
Education Outside
Animal Homes in the Garden
First graders journey to the school garden to examine the habitats of garden animals. Using the provided graphic organizer, kids locate and sketch a critter and its habitat before returning it to its home.
Student Handouts
Process Steps
A straightforward graphic organizer is a great way to outline steps for any subject. Kids fill out 10 steps to describe a process or brainstorm writing, with small arrows indicating that one step leads to the next.
K-5 Math Teaching Resources
Venn Diagram Template
Prevent your students from making a disaster out of their writing journals while attempting to draw their own graphic organizer. Instead, use this perfectly proportioned template of a Venn diagram.
EngageNY
Grade 9 ELA Module 1, Unit 1, Lesson 15
How much progress has Claudette made at the end of "St. Lucy's Home for Girls Raised by Wolves"? Ninth graders note evidence for and against Claudette's successful adaptation into human society with a graphic organizer. Additionally,...
Curriculum Corner
Fiction Graphic Organizers
Get an in-depth look into a narrative text with a three-page worksheet that examines a story's character—actions, sayings, thoughts, and appearance—setting, and challenges scholars to write a brief summary about what they've read.
Curated OER
Organizing by Writing
Middle schoolers analyze how to use writing for generating and organizing their thoughts before communicating them. They use the questions on the first handout to organize a three-minute introduction of themselves to their small group....
Charleston School District
Solving Systems Graphically
When guess and check gets old, it's time to start graphing! An instructive lesson explains how to solve a system of linear equations using graphing. Equations are in both slope-intercepts and standard form.
Kimskorner4teachertalk
Foreshadowing
Take a look at foreshadowing in any text by recording instances of foreshadowing in a straightforward graphic organizer. Learners note down the event, the clue, and the page number for five foreshadowed events. There is also space for...
EngageNY
Carl Hiaasen’s Perspective of Florida: Part 3
What is your perspective? Scholars read Florida: A Paradise of Scandals Excerpt 2 and look for unfamiliar words. They determine author perspective by completing Gathering Evidence of Hiaasen’s
Perspective: Part three graphic organizer...
Kenan Fellows
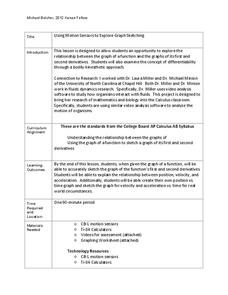
Using Motion Sensors to Explore Graph Sketching
Get moving to a better understanding of graphs of derivatives. Using motion sensors, scholars vary their velocities to create graphs of the first derivative of a function. The activity challenges groups to first create a script of the...
EngageNY
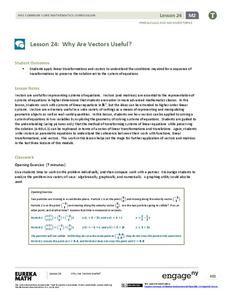
Why Are Vectors Useful? 2
Investigate the application of vector transformations applied to linear systems. Individuals use vectors to transform a linear system translating the solution to the origin. They apply their understanding of vectors, matrices,...
Curriculum Corner
Informational Text Graphic Organizers
Scholars delve into an informational text with the help of four pages that focus on the author's purpose, vocabulary words, summarization, and main idea.
EngageNY
Using Trigonometry to Find Side Lengths of an Acute Triangle
Not all triangles are right! Pupils learn to tackle non-right triangles using the Law of Sines and Law of Cosines. After using the two laws, they then apply them to word problems.
EngageNY
Calculating Probabilities of Events Using Two-Way Tables
Tables are useful for more than just eating. Learners use tables to organize data and calculate probabilities and conditional probabilities.
EngageNY
Calculating Conditional Probabilities and Evaluating Independence Using Two-Way Tables (part 2)
Without data, all you are is another person with an opinion. Show learners the power of statistics and probability in making conclusions and predictions. Using two-way frequency tables, learners determine independence by analyzing...


