Curated OER
Complex Analysis: Linear Transformations, Inversion Mappings
In this transformation worksheet, students identify a series of transformations and sketch them. They use inversion mapping to establish a one-to-one correspondence between nonzero points. This four-page worksheet contains...
Curated OER
Reading distance on maps
Eighth graders complete worksheets on reading the distance on maps in miles or kilometers. In this maps lesson plan, 8th graders use a calculator and ruler.
Curated OER
Coordinate Grid: Mapping an Archaeological Site
Students examine how archaeologists preserve context of sites through use of rectangular grid or Cartesian coordinate system, and develop sense of distance by pacing off and estimating distances.
Curated OER
Building a Scale Model
Third graders create a model of the solar system. In this solar system lesson, 3rd graders create a scale model of the solar system. Working in pairs students solve mathematical problems to correctly measure the distance each planet is...
Curated OER
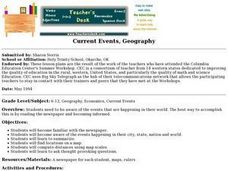
Current Events, Geography
Students read the newspaper to become aware of what is happening in their city, state, nation, and world. They summarize, find locations on a map and ask thought-provoking questions.
Curated OER
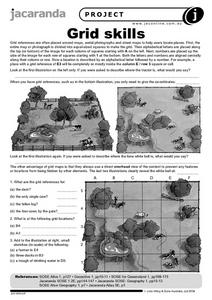
Grid Skills
In this geography learning exercise, students use grid references on a map to locate places in the pictures given. They also identify another advantage of using a grid map, which they have an overhead view of the content to prevent any...
Curated OER
One Size Fits All?
Students describe the differences between an estimate and a guess. They create reasonable estimates based on comparison and activities. Students explain how estimation is helpful in showing the relative size on a scale. They also...
Curated OER
Johnny Appleseed Walkabout
Second graders calculate mileage for a journey. In this place value and measurement lesson, 2nd graders read Johnny Appleseed, work in groups to locate his birthplace on a map, locate the other states he stopped in, and measure the...
Curated OER
Musical Plates-Earthquakes
In this plotting earthquake data worksheet, middle schoolers use a large world map and given web sites showing the latitude and longitude for the epicenter of recent earthquakes around the world. Students plot 2 weeks of earthquake data...
Curated OER
Comparing the New Madrid and San Andreas Fault Zones
In this faults learning exercise, students use an earthquake reference sheet to find the numbers for a modified Mercalli and Richter scale. They compare the San Andreas Fault zone and the New Madrid fault zone on the United States map....
Curated OER
Me on the Map Lesson 2
Young scholars analyze and interpret maps, globes and geographic information systems to define and identify cities, counties, states, countries and continents to create a booklet called me on the map. They also determine and calculate...
Curated OER
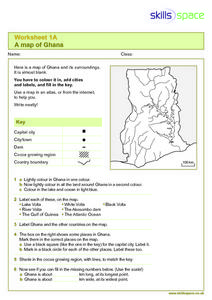
A Map of Ghana
In this Map of Ghana worksheet, students are given a blank map and key. They are told to label major features and color according to directions.
Curated OER
Maps, Charts, and Graphs
Students define key geographic terms and track a hurricane on a map. They examine various types of maps and find locations on them,including rivers, cities and mountains.
Curated OER
US City Quality of Life Analysis and Comparison
Students analyze US census data and criteria to compare and measure the quality of life in the country's fifty largest cities. After accessing the 2005 quality of life world report online, students conduct their study to compare three...
Noyce Foundation
Photographs
Scaling needs to be picture perfect. Pupils use proportional reasoning to find the missing dimension of a photo. Class members determine the sizes of paper needed for two configurations of pictures in the short assessment task.
Science Matters
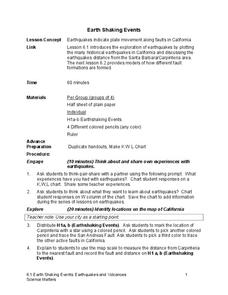
Earth Shaking Events
The world's largest measured earthquake happened in 1960 in Chile, reaching a terrifying 9.5 magnitude on the Richter Scale. The second lesson in the 20-part series introduces earthquakes and fault lines. Scholars map where previous...
Big Learning
The Antarctica Project: A Middle School Mathematics Unit
Antarctica is a big place, large enough to provide ample opportunities to learn about math. A two-week unit teaches middle school mathematics concepts using project-based learning. The resource covers functions, geometry (area,...
Curated OER
The History of Life on Earth
Using meters as years, your class works together to map out the geologic time scale on a football field. Plenty of background information is included in this lesson plan as well as several resource links and a student worksheet. Your...
Curated OER
Separate Vacations
Students plot the migration paths of birds using latitude and longitude data from a table.
Chicago Botanic Garden
Climate Change Around the World
Look at climate change around the world using graphical representations and a hands-on learning simulation specified to particular cities around the world. Using an interactive website, young scientists follow the provided directions to...
Curated OER
Scale
Students apply concepts of scales to solve problems. In this geometry activity, students solve real world problems using scales, proportions and ratios. They predict the actual size of a model given the scale drawings.
Curated OER
Cookie Mapping
Students study the components of a bedrock geology map through a hands-on activity involving a cookie and graph paper.
Curated OER
Hurricane Winds: A Spatial Hierarchy of Processes at Different Scales
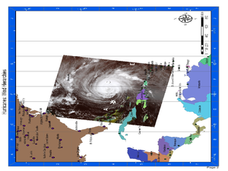
In this earth science lesson, middle schoolers study a satellite image of hurricane Isabel and write answers to 5 questions that follow. They match predictions to the map locations.
Curated OER
Using Venn Diagrams to Compare Two Ecosystems
Students explore the distribution of two ecosystems on a global scale; and map the distribution of tropical and temperate rain forests throughout the world. They use a Venn Diagram to describe these ecosystems and the differences between...


