Curated OER
Solve for Scale Factors Using Proportions
Eighth graders solve problems using proportions with scaled drawings. They work with maps and blue-prints discussing scales and plans and examine different polygons and figure out the scale factors or proportions they have been changed by.
Curated OER
Tooling Around Arizona: Reading Arizona Maps
Students research Arizona maps. In this map lesson, students discuss map titles, scales, directions, elevation, and symbols. The class will examine topography, landforms, and rivers found on an Arizona map.
Curated OER
Me on the Map Lesson 1
Students use maps, globes, geographic information systems and other
sources of information to analyze the nature of places at a variety of scales. They identify on a map and determine the population
of the city, county, state, country...
Curated OER
Map It With Pixie
Fourth graders use the computer program 'Pixie' to create a topographic, detailed map for the state they live in. In this mapping skills lesson, 4th graders use Pixie to make a map of their state that includes topographic features, state...
Laboratory for Atmospheric and Space Physics
Charting the Progress of New Horizons
In 2006, New Horizons began its mission to fly to Pluto. As it continues its journey, scholars track its progress with the help of an informative website, all the while reinforcing measurement concepts with the construction of a scaled...
EngageNY
Properties of Dilations
Investigate dilations to learn more about them. The second segment in a series of 16 provides a discussion of properties of dilations by going through examples. The problem set provides opportunities for scholars to construct dilations.
Curated OER
The Landscape of a Novel
Students, after reading a novel, utilize geographic skills to map out the places described in the novel. They collect data, envision spatial features and then design a map to work off of to complete their assignment. Each student also...
Laboratory for Atmospheric and Space Physics
A Classroom Solar System
Create a scaled model of our solar system in your classroom! Scholars work collaboratively to build paper mache planets and hang them in their proper position to showcase each planet's location in the solar system.
NOAA
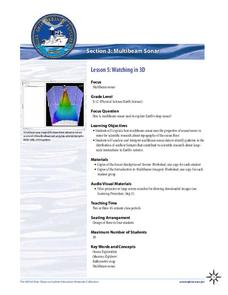
Watching in 3D
Bring the ocean floor to life! Earth science scholars discover the process of deep sea mapping in the third installment in a series of five lessons about ocean exploration. The teacher's guide includes helpful resources, worksheets, and...
Curated OER
MAPS AND TOPOGRAPHY
Students analyze the details of a topographic map and create one of their own by utilyzing a map of elevations.
Curated OER
Tracking Satellites Using Latitude and Longitude
Students, viewing an Internet site, plot the path of several satellites using latitude and longitude over the course of an hour. They learn the four basic types of satellites and their purpose.
Curated OER
Using Local Geography to Make Maps
Students research, create, and present a scale representation of the county in which they live.
Carnegie Mellon University
International Perspectives to Climate Change 1
After a lecture about how the first industrial revolution triggered the path to climate change, your environmental studies class discusses what the impacts are. In a culminating activity, they get into groups and identify countries on a...
Curated OER
What Are Maps For?
Students create a story about a problem someone could have which could be solved by the use of a map. They complete a worksheet that guides them through the features of a map of Chicago. Then they calculate story problems using the...
Curated OER
Understanding Topographic Maps
Underclassmen create a cone-shaped landform and then draw a contour map for it. Then they examine a quadrangle (which was easily located with an online search), and relate it to what they experienced. The accompanying worksheet is...
Curated OER
Africa: Introduction, Geography and Mapping
Learners study the geography of Africa through the use of maps. They locate, distinguish, and describe the relationships among varying regional and global patterns of geographic phenomena such as landforms, climate, and natural resources.
Curated OER
Map the Civil War
Students explore the Civil War through original maps. For this mapping lesson, students calculate distance and show it on an original map. Students examine the type of landscape and its landmarks and draw symbols on the map.
Curated OER
US City Quality of Life Analysis and Comparison
Students analyze US census data and criteria to compare and measure the quality of life in the country's fifty largest cities. After accessing the 2005 quality of life world report online, students conduct their study to compare three...
Curated OER
Understanding "The Stans"
Students explore and locate "The Stans" in Central Asia to create, write and illustrate maps, graphs and charts to organize geographic information. They analyze the historical and physical characteristics of Central Asia via graphic...
Curated OER
Earth's Water
If the majority of our planet is covered with water, why do we need to bother conserving it? With a thorough and varied investigation into the location and types of water on the earth, learners will gain an understanding of why this...
Curated OER
What do Maps Show?
Eighth graders practice the skill of reading maps. In this geography instructional activity, 8th graders participate in a classroom lecture on how to read a map.
Science Matters
Wattsville and Mercalli Booklet
There has been an earthquake! Can you listen to the description of damage given by callers in order to determine the epicenter? The 11th of 20 lessons has pupils read a script of one emergency caller. The class records the information on...
Science 4 Inquiry
Edible Plate Tectonics
Many people think they can't observe plate tectonics, but thanks to GPS, we know that Australia moves at a rate of 2.7 inches per year, North America at 1 inches per year, and the Pacific plate at more than 3 inches per year! Scholars...
Curated OER
Assessing and Making Maps
Students evaluate maps using the TODALSIGs basic map analysis system, explained on the worksheet. They create a map of Alaska using TODALSIGs. Students brainstorm the elements of maps.


