Curated OER
Blast the Fats
Students examine the fats found in foods. In this nutrition lesson, students identify the types and amounts of fats found in foods as they research food labels and the Internet. Students classify the fats and record their data.
Curated OER
Who's On First?
Have you ever considered why the number 10 is so important to us? That's what learners do here. They explore patterns formed by powers of ten and by decimals, convert units of measure within the metric system, and express these in the...
Earth Day
Introduction To Scale Drawings
Real-life math is really great! In groups, learners measure objects in the classroom. After comparing measurements, they determine a scale and create a blueprint of the classroom. They discuss the purpose of using scale drawings in...
Curated OER
Comparing School Bus Stats
Engage in a lesson that is about the use of statistics to examine the number of school buses used in particular states. They perform the research and record the data on the appropriate type of graph. Then they solve related word problems.
Curated OER
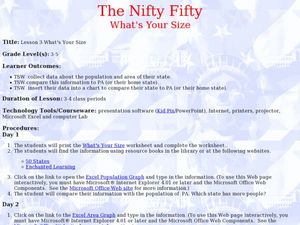
The Nifty Fifty-What's Your Size?
Students explore state populations. In this state geography lesson, students use a variety of technology tools to research and graph population and area of assigned states.
Curated OER
A Counting Photo Book
Students use iPhoto to create their own counting books. They come up with objects that can illustrate each number to 10. Working in pairs or individually, students use a digital camera to take photos of sets of objects to use in their book.
Curated OER
Telling Time for Grade 3
Ten questions are provided to review elapsed time. Your third graders will like that some questions provide visual representations to guide learners. Use Internet Explorer if you want this worksheet to print in its proper format.
Curated OER
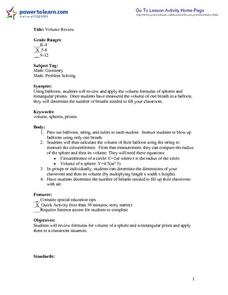
Volume Review
Learners investigate the concepts of volume for rectangular prisms and spheres. They measure the volume of one balloon and then consider how many breaths it would take to fill the room with balloons. The rectangular prism being measured...
Curated OER
Area & Perimeter Assessment And Practice
Using a pre-test, this lesson starts by establishing differentiated learning groups. Each group practices determining area and perimeter using interactive web sites small groups are then pulled aside and given additional support as...
Curated OER
Extreme Elevations
Seventh graders use highest and lowest points of land elevation around the world to find the differences. Sea level is zero, so students be operating with positive and negative numbers. After students find the information on the...
Curated OER
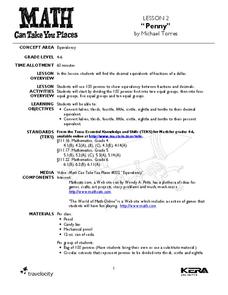
Penny
Students explore the concept of equivalency. In this equivalents lesson, students use pennies to show equivalency as they divide them into groups. Students also convert the pencils into decimals and fractions.
Curated OER
Butterfly Addition: Color by Numbers
Children learning to add numbers up to 11 develop the strategy of using the larger number as the first addend and counting on from there to find a sum. They define addition and review the meaning of the plus (+) symbol. To practice, they...
Curated OER
Net "Working"
Upper elementary and middle schoolers explore the properties of various polygons. They use video, resource links, and engage in hands-on activities in order to construct geometric nets. This fine plan should lead to increased...
Curated OER
Making Numbers Manageable
Eighth graders recognize and express numbers when written in time saving techniques. They gather data from a variety of sources, including print and electronic media. They develop a presentation using a variety of techniques.
Curated OER
Numbers Scavenger Hunt
Students use computers and Internet to research specified topics using given sites. They print the researched information, and create a PowerPoint presentation.
Learn NC
Peanut Butter and Jelly and Order of Operations
Study order of operations using a peanut butter and jelly sandwich activity as your guide. The class watches you make a peanut butter and jelly sandwich based on a volunteer's instructions. They discuss the importance of following...
Curated OER
Integers in the Weather
Middle schoolers engage in a clever instructional activity that combines meteorology with mathematical thinking. They use integers in relation to high and low temperatures that they record. They use a spreadsheet of weather data, a...
Curated OER
Louisville's Best Field Day Park
Students create a survey to hand out to determine the best field day park. Using their local area, they select five parks, if possible, that meet the criteria and calculate the distance and estimated time travel. They use this...
Utah Education Network (UEN)
It's All Just Similar to Me
Middle schoolers explore the concept of similar figures. In this similar figures lesson, pupils calculate scale factors of similar triangles. They find missing sides of triangles, and measure angles using protractors and measure sides of...
Curated OER
Mean and Standard Deviation
Get two activities with one lesson. The first lesson, is appropriate for grades 6-12 and takes about 20 minutes. It introduces the concept of measures of central tendency, primarily the mean, and discusses its uses as well as its...
Curated OER
Mathematics & Nutrition
Students apply math to calculate fat and calories in the food they eat. They examine food package information to become aware of the ingredients and to learn about healthy life styles. They work in groups to create crazy meals using the...
Curated OER
What Drives the Stock Prices?
Learners discover that earnings drive stock prices. They look for earnings growth from the continuing operations of a business. They also use price-to-earnings ratio as one of the tools in choosing stocks for the Global Stock Game.
Curated OER
"Pi" Day
Your class will complete research dealing with Pi and its value in mathematics, leading into a discovery lab to demonstrate Pi, how it is determined, and how it is used. In the end, students eat PIE!
Curated OER
ExplorA-Pond: 6th Grade Area and Random Number Tables
Sixth graders estimate surface area of a pond using a random number table.


