Curated OER
Weather Watchers
Students identify basic weather instruments and how they are used to record weather data. Students define several vocabulary terms as stated in lesson. Students use basic instruments to record weather data in their area. Students use the...
Mrs. Burke's Math Page
Let Them Eat Pi
Looking for a fun and creative way to celebrate Pi Day? Then this is the resource for you. From a scavenger hunt and trivia contest to PowerPoint presentations and skills practice worksheets, this collection of materials is a...
Statistics Education Web
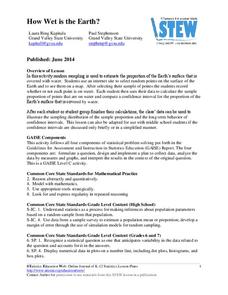
How Wet is the Earth?
Water, water, everywhere? Each pupil first uses an Internet program to select 50 random points on Earth to determine the proportion of its surface covered with water. The class then combines data to determine a more accurate estimate.
Shodor Education Foundation
Plop It!
Build upon and stack up data to get the complete picture. Using the applet, pupils build bar graphs. As the bar graph builds, the interactive graphically displays the mean, median, and mode. Learners finish by exploring the changes in...
Shodor Education Foundation
Derivate
Derive tangent lines through derivatives. Scholars use an app to graph functions and investigate derivatives and tangent lines. The interactive automatically graphs a tangent line at a specified point and can also produce tables of values.
Shodor Education Foundation
Data Flyer
Fit functions to data by using an interactive app. Individuals plot a scatter plot and then fit lines of best fit and regression curves to the data. The use of an app gives learners the opportunity to try out different functions to see...
Shodor Education Foundation
Graphit
No graphing calculator? No worries, there's an app for that! Young mathematicians use an app to graph functions. In addition, they can also plot data points.
Shodor Education Foundation
Conic Flyer
Graphing conics made easy. Individuals use an interactive to graph conic sections. The app can handle circles, vertical and horizontal parabolas, ellipses, and vertical and horizontal hyperbolas.
Shodor Education Foundation
Cross Section Flyer
Scholars see cross sections come to life using an app to investigate cross sections of three-dimensional solids. They look at prisms, pyramids, cylinders, cones, and double cones.
Shodor Education Foundation
Regression
How good is the fit? Using an interactive, classmates create a scatter plot of bivariate data and fit their own lines of best fit. The applet allows pupils to display the regression line along with the correlation coefficient. As a final...
Shodor Education Foundation
Scatter Plot
What is the relationship between two variables? Groups work together to gather data on arm spans and height. Using the interactive, learners plot the bivariate data, labeling the axes and the graph. The resource allows scholars to create...
Shodor Education Foundation
Stem and Leaf Plotter
The key is in the leaves. Pupils enter data to create a stem-and-leaf plot. The resource then displays the plot and calculates the mean, median, and mode of the data. Using the plot and the calculated measures of spread, learners analyze...
Shodor Education Foundation
Multi-Function Data Flyer
Explore different types of functions using an interactive lesson. Learners enter functions and view the accompanying graphs. They can choose to show key features or adjust the scale of the graph.
Curated OER
Ornithology and Real World Science
Double click that mouse because you just found an amazing lesson! This cross-curricular Ornithology lesson incorporates literature, writing, reading informational text, data collection, scientific inquiry, Internet research, art, and...
Curated OER
Using the Web to Explore Shapes
Third graders research the Internet to locate geometric designs in familiar buildings. They review shapes, solids, angles and symmetry as they research websites of familiar buildings in Louisville. They record the information they see...
Curated OER
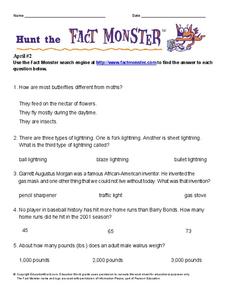
Hunt the Fact Monster
In this Fact Finder worksheet, students access the Internet to a specific site to find the answers to five questions with multiple choice answers.
Curated OER
Build Your Dream Bedroom
Designers measure their own rooms and produce a scale drawing. They use the Internet to visit sites to find the costs of purchasing new carpet, paint, or anything else they would like to add to their room. Using a $1500 budget, they will...
Houghton Mifflin Harcourt
Intensive Math
Three chapters worth of integer, fraction, and decimal problems to give you every type of question your learners need to be a successful mathematician. Thankfully the work has been done for you and this is a huge resource full of...
Curated OER
Does My hair Disrupt Your Learning?
Students use the internet to research ways to save and earn money. They interview bankers and financial counselors to discover different types of investments. Students create public service announcements to inform their classmates of...
Curated OER
Patch Tool
Students use an Internet tool to explore shapes and how they combine. In this patterns lesson, students create quilting patterns using various shapes. Students recognize how the shapes fit together.
Curated OER
Start Your Engines: An Internet Research Lesson
Fifth graders engage in a lesson which offers informational how-tos for conducting research on the Internet. Three search engines are introduced and used to gather information to solve a specific problem.
Curated OER
February Facts Internet Hunt
In this February facts Internet hunt worksheet, students use search engines and linked websites to answer 30 questions about topics from all subject areas. This page has numerous links to helpful web resources.
Curated OER
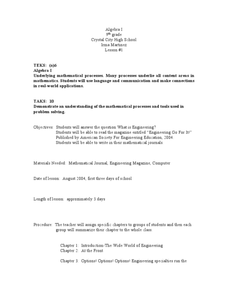
Problem Solving Using Math
Learners solve real life scenarios using algebra. In this word problem lesson, students use different websites dealing with engineering as it relates to the real world and math. They use other resources such as magazines to solve word...
Curated OER
Discovering Math-Concepts in Advanced Algebra
Students research The Nine Chapters on the Mathematical Art and Chinese contributions to mathematics using both print and non-print sources. From their research they create an illustrated table of contents for each chapter of the Nine...


