101 Questions
The Biggest Loser
Sometimes losing is actually winning! Learners use a proportional analysis to compare percent weight loss of contestants on The Biggest Loser. The resource provides data and clips from the show to facilitate the lesson.
Houghton Mifflin Harcourt
Unit 6 Math Vocabulary Cards (Grade 6)
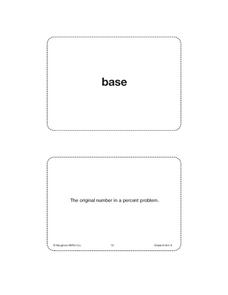
Fifty-eight flashcards make up a set designed to reinforce math vocabulary. Within the set, you'll find bold-faced word cards as well as definition cards that offer a labeled example. Terms include base, percent, theoretical probability,...
National Research Center for Career and Technical Education
Back to Basics
Your class will enjoy this Health Science lesson created by CTE and math teachers from Missouri. Learners make conversions between the apothecary system and metric and US standard measurements used in the healthcare field. The CTE...
Bowland
Explorers – Patrol Services
Far out — plan a trip to space! Aspiring mathematicians steer a space vehicle through an asteroid field, calculate currency exchanges to buy provisions, and determine placement of charges to blow up asteroids. Along the way, they learn...
Newspaper Association of America
By the Numbers: Mathematical Connections in Newspapers for Middle-Grade Students
A cross-curricular resource teaches and reinforces mathematical concepts with several activities that use parts of a newspaper. Scholars use scavenger hunts to find the different ways math is used in the paper along with using data...
CCSS Math Activities
Smarter Balanced Sample Items: 7th Grade Math – Claim 3
Does the explanation make sense? Sample items highlight claim three, communicating reason, in the Smarter Balanced assessments. Teachers use the 16 items to help show pupils the importance of communication and reasoning within...
Curated OER
Candy Machine
Using the concept of a candy vending machine, young mathematicians explore the sugar ratios found in different types of candy. Using the provided information, class members calculate and compare different ratios in order to find the...
PBS
The Lowdown — Exploring Changing Obesity Rates through Ratios and Graphs
Math and medicine go hand-in-hand. After viewing several infographics on historical adult obesity rates, pupils consider how they have changed over time. They then use percentages to create a new graph and write a list of questions the...
Curated OER
Family Letter and Activity: Cars, Trucks and Percents
In this math worksheet, students will take home a letter to their parents explaining that they are studying Chapter 10: Ratio, Proportion and Percent. Then students will complete a homework activity in which they ask family and friends...
Curated OER
Percents Less Than One and Greater Than 100
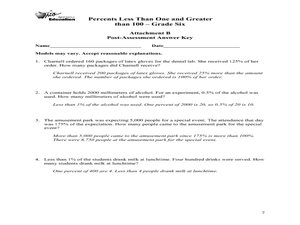
Sixth graders express numbers as percents greater than 100 and less than one. In this lesson on percents, 6th graders work in groups with real life scenarios to develop an understanding on percentages greater than 100 and less than one....
Curated OER
Fractions, Decimals to Percents
Seventh graders convert fractions and decimals to percents. Using measuring cups, 7th graders model fraction/percent equivalents. They discuss how to change a decimal to a percent. Using the white boards, students review the different...
Curated OER
Ratio and Proportions
Students explore the means and extremes of a proportion, the how to make a scale drawing.
Curated OER
Science Fair Space
Students determine the most equitable way to share space and cost between three schools for a fictional science fair. Given a diagram, a word problem, and a data set, students analyze and explain the best way for all schools to share...
Curated OER
Shots, Standings, and Shopping
Rates and ratios can easily be applied to real-world situations. Learners explore a series of websites in order to procure comparable data. They define ratios and rates, view videos, and use the internet to explore how ratios and rates...
Curated OER
Empirical Rule Practice Problems
Using the empirical rule for a normal distribution, young statisticians determine the percent of adult women with given heights and weights. They find the percentile rank of a woman of a stated height and find the area under a curve.
Florida Center for Instructional Technology
Integrating Mathematics into Literature
You class will read Cucumber Soup by Vickie Leigh Krudwig as an anticipatory set for this lesson on ratios. They make models of the insects in the story and then use them as a source of data for this ratio and proportion lesson. This...
Achieve
Framing a House
If members of your class wonder where they can use the math they learn in middle school, let them discover the answer. Learners apply geometry concepts of scale and measure to calculate the costs of framing a house addition.
Concord Consortium
Hockey Pucks
Package design is a mathematical task for any business. Young scholars use a package design to determine the number of packages required for specific shipments. Using ratios, proportions, and fractions, they make decisions about the best...
Achieve
Ground Beef
Ever wonder how a butcher creates the different types of ground beef? Young mathematicians explore the methods butchers use to create their desired ground beef quality. Given a combination of two types of meat with varying leanness,...
Inside Mathematics
Swimming Pool
Swimming is more fun with quantities. The short assessment task encompasses finding the volume of a trapezoidal prism using an understanding of quantities. Individuals make a connection to the rate of which the pool is filled with a...
Math Worksheets Land
Find Percentages of Numbers - Step-by-Step Lesson
Finding a percentage of a number is a skill learners must know in order to be successful thinkers. The resource introduces this concept with a guided explanation and can be used with the additional materials as a complete lesson.
Curated OER
Probability using M & M's
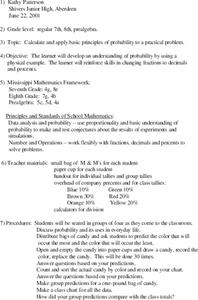
Using M & M's candies, young statisticians predict the color distribution in a packet of candies and test their predictions against their group and the larger class. A review of converting between fractions, decimals, and percents...
Curated OER
What proportion of rough rice is prepared into consumable rice?
Fifth graders find the percentages of rough rice that can be eaten. In this percentage instructional activity, 5th graders look at 100 lbs. of rough rice and see the steps needed before it can become the white rice sold in stores. They...
Curated OER
Stoichiometry
In this stoichiometry worksheet, students use balanced equations for chemical reactions to determine the percent yield and the mass of product produced. This worksheet has five problems to solve.


