Bowels Physics
Graphical Analysis
Assist your class in learning graphical analysis by reviewing the slide presentation. Class members review 15 slides to further understand concepts such as velocity and acceleration. They conclude with practice problems related to the...
Teach Engineering
Matching the Motion
It is not always easy to walk the straight and narrow. In the sixth portion of a nine-part unit, groups actively recreate a graph depicting motion. Individuals walk toward or away from a motion detector while trying to match a given...
Curated OER
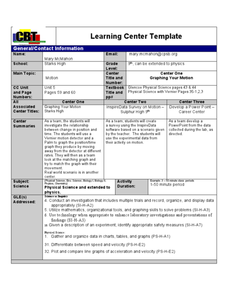
"Graphing Your Motion"
Students study the concepts of motion, velocity, and acceleration through graphing their own movement using LoggerPro. They explain the difference between speed and velocity using the weather vane example. They discover the difference...
Curated OER
Graphing Linear Motion
In this graphing linear motion worksheet, learners answer 20 questions about velocity of objects, the distance they travel and the time. They interpret a graph of position vs. time and identify the velocity at certain point on the graph.
Curated OER
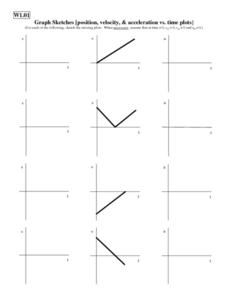
Graph Sketches
In this graphing activity, learners use velocity vs. time graphs to create speed vs. time and acceleration vs. time graphs. Students create 24 graphs.
Curated OER
Position, Velocity & Acceleration vs. Time
For this motion worksheet, students use a graph showing the velocity of an object over time to describe the motion of the object and to determine the position of the object at different intervals. Then students create speed vs. time and...
Curated OER
Acceleration and Average Speed
In this acceleration and average speed worksheet, students learn the equations for acceleration and average speed. They match 6 variables with their quantities, they identify speed vs. velocity and scalar vs. vector and they solve 4...
Curated OER
Velocity
In this velocity worksheet, students solve 13 problems including finding acceleration of objects, forces on objects, velocity of objects and interpreting graphs of position vs. time.
Curated OER
Acceleration 2
In this acceleration worksheet, students experiment with varying amounts of mass to observe the effects on the force needed to move an object. Students apply Newton's Second Law of Motion to describe the relationship between mass and...
Edmond Public Schools
8th Grade Science Resource Book: Unit 2 - Physics
Get things moving with this extensive collection of physical science resources. Covering the fundamentals of measurement, graphing, lab safety, and experimental design as well as the specific scientific concepts of velocity,...
Curated OER
Position, Velocity & Acceleration vs. Time Graphs
In this motion activity, students use a graph showing velocity vs. time to create a speed vs. time graph and an acceleration vs. time graph. Students label all critical values along the y-axis.
Curated OER
Linear Motion 5
In this linear motion worksheet, high schoolers answer 9 questions about velocity, acceleration and position of objects. They solve problems for acceleration and velocity and they interpret graphs of velocity vs. time, acceleration vs....
Curated OER
Motion Basics
Quiz those kids to assess what they've gleaned from your last lesson on Newton's laws of motion. There are 10 questions that have learners define force, acceleration, velocity, and speed. A bonus question has them write a motion story...
Curated OER
Speed
Fifth and sixth graders practice working in pairs to determine whether they can walk with constant speed. They test themselves, collect their data, draw graphs with their data collected, manipulate the data, and then draw conclusions...
CK-12 Foundation
Irwin and Ruthie
Learners compare acceleration to displacement through an interactive tutorial that permits them to adjust the running strategy of two robots and watch them race. A graph displays the robot's velocity over time and another shows their...
Curated OER
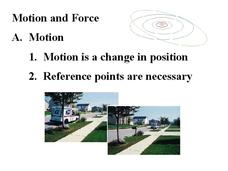
Motion and Force
All the main concepts in motion and force are covered in this presentation. Each slide is a great summary and will appeal to your students with a clean design and images that should seem relevant. Definitions of speed, displacement,...
CK-12 Foundation
Irwin 2D
Learners explore two-dimensional motion through visual modeling with an interactive lesson that allows them to control the path of a robot. Graphs show both the horizontal and vertical motion as the robot continues through its entire route.
Curated OER
Worksheet 3: Graphing Speed and Time
In this graphing speed and time worksheet, learners answer 7 questions regarding graphing, speed, distance, derivatives, Newton's method and wheel radius.
Curated OER
Elevator Height as Integral of Velocity
Pupils investigate integrals and their relationship to velocity in this calculus lesson. They use the idea of a moving elevator to explore vertical motion and use the TI to help them create a visual.
CK-12 Foundation
Cliff Diver
Cliff diving is more than an adrenaline rush ... it's a lesson in physics! Scholars adjust the height of a cliff and plot the resulting velocity and position over time on graphs. They also can incorporate air resistance to monitor the...
Curated OER
Velocity vs. Time
Twelfth graders read and interpret v-t graphs. After studying velocity and time, 12th graders read graphs to calculate the acceleration of a moving body and determine the distance and displacement of a body. Students explore the...
Curated OER
Graphing Your Motion
Seventh graders investigate velocity and speed. In this Vernier Probe instructional activity, 7th graders will use probes to calculate motion, speed, and velocity of an object. They will create a graph of their collected data.
Curated OER
Motion Graphs
In this motion graphs activity, learners learn about how motion of objects can be described using a graph. Students then answer 10 fill in the blank, 10 short answer, and 5 problems to solve.
Curated OER
Position vs. Time and Velocity vs. Time Graphs
For this constant velocity worksheet, students use data of position vs. time of a roller-skater to determine speed, acceleration, or deceleration at different points along the path. Students rank graphs according to average velocity and...


