CK-12 Foundation
Relative Velocity Simulation
If your pupils think relative velocity is the velocity at which you can run away from your relatives, they need this simulation. Two bikers want to meet at a specific time. Scholars alter the velocity of one rider to arrange the...
Curated OER
Velocity and Acceleration
Compliment your physics lesson with this PowerPoint which demonstrates many important points regarding acceleration and velocity. A starter experiment activity to stimulate student thinking is given, and may prove very interesting to a...
Curated OER
Acceleration Science
In collaborative groups, physics learners design and create a web portfolio of internet resoucres explaining poitive and negative acceleration, zero acceleration, and positive and negative velocity. This is a terrific assignment for...
Physics Classroom
Graph That Motion
Pupils apply their knowledge of the shape and slope of graphs to interpret the motion of an object. Three levels of difficulty provide plenty of practice with support thanks to the "Help Me!" button offered with each question.
Curated OER
Unit III: Worksheet 3 - Uniform Acceleration
This three-page worksheet moves physics masters to show what they know about motion. They analyze graphs of time versus displacement, solve instantaneous and average velocities, solve word problems, and graph results. This is an...
Curated OER
Acceleration Lab
Young Einsteins experiment with the acceleration of Hot Wheels™ toy cars down inclined planes at various angles. This classic physics lab activity is thoroughly explained in both a teacher’s guide and a student lab sheet. Science...
Curated OER
Lesson 3: Acceleration and Force
A nine-page physics resource supports your lesson on acceleration. A step-by-step lesson plan walks you through the materials you need, the background information, steps for leading experimentation, and the explanation of the results....
Curated OER
Unit II: Worksheet 1 - Velocity
Beginning physics scholars interpret two graphs depicting position versus time. For each graph, there is a series of questions to answer. The exercise is basic, but beneficial. Consider using it as an assessment of understanding after...
Urbana School District
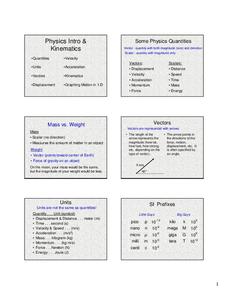
Physics Intro, Kinematics, Graphing
Some consider physics the branch of science concerned with using long and complicated formulas to describe how a ball rolls. This presentation, while long, is not complicated, yet it covers rolling, falling, and more. It compares vectors...
Curated OER
Unit III: Worksheet 1 - Uniform Acceleration
This concise handout posts a diagram of a block sliding down a ramp. High schoolers draw qualitative graphical representations for displacement vs. time, velocity vs. time, and acceleration vs. time. They draw a motion map and list the...
Curated OER
Motion: Speed, Velocity, Acceleration and Networking
Students interpret a variety of motion graphs. In this physics lesson, students calculate the speed and acceleration of objects using numerical data from graphs. They apply what they have learned to solve real world problems.
Teach Engineering
Accelerometer: Centripetal Acceleration
Scholars build robotic arms that swing back and forth and use them to collect velocity and acceleration data. To analyze the results, pupils compare data to the equations for angular velocity and centripetal acceleration.
Physics Classroom
Dots and Graphs
Scholars demonstrate understanding of kinematic graphs through matching dot graphs to position time graphs, dot graphs to velocity graphs, and a mixture of the two. If users feel stuck or confused, a Help Me! button offers an explanation...
Physics Classroom
Match That Graph
Matchy-matchy no longer exclusively applies to fashion. Scholars work through three levels of practice matching position and velocity graphs. Part of a series covering dimensional kinematics, each question provides immediate feedback and...
Curated OER
Velocity, Acceleration, and Gravity
Students perform an experiment where a string is tied across the room. A straw is threaded onto the string, and a balloon attached to the straw. Students determine the speed of the balloon as it moves across the string. They repeat the...
Curated OER
Stars and Slopes
More of a math lesson than physics or space science, high schoolers take a set of data and plot it on a log-log coordinate system. The write-up for day two was never completed, but day one, "Stars and Slopes," is complex and cohesive....
Curated OER
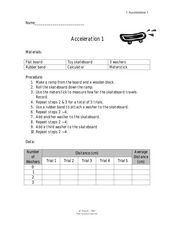
Acceleration 1
In this acceleration worksheet, students use weights to increase the mass affecting the force on moving objects. Students plot a graph of their data and answer 3 questions about how the acceleration of the toy skateboard used in the...
Curated OER
Regents High School Examination - Physics 2010
Give every type of learner in your physics class an opportunity to demonstrate what they have learned throughout the year. From analyzing tables and graphs, to evaluating diagrams and solving problems, there is an outstanding variety of...
Curated OER
Linear Motion: Speed, Velocity & Acceleration
Learners explore the concept of linear motion. For this linear motion lesson, students calculate distance and time in order to calculate average speed and velocity in the provided problems.
Bowels Physics
Graphical Analysis
Assist your class in learning graphical analysis by reviewing the slide presentation. Class members review 15 slides to further understand concepts such as velocity and acceleration. They conclude with practice problems related to the...
Curated OER
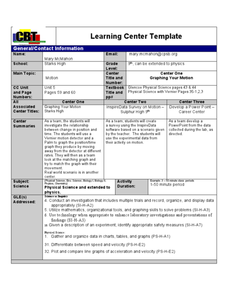
"Graphing Your Motion"
Students study the concepts of motion, velocity, and acceleration through graphing their own movement using LoggerPro. They explain the difference between speed and velocity using the weather vane example. They discover the difference...
Curated OER
Graphing Linear Motion
In this graphing linear motion worksheet, learners answer 20 questions about velocity of objects, the distance they travel and the time. They interpret a graph of position vs. time and identify the velocity at certain point on the graph.
Curated OER
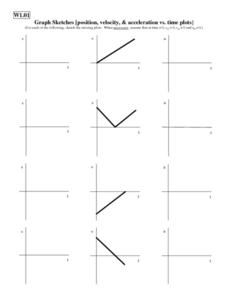
Graph Sketches
In this graphing activity, learners use velocity vs. time graphs to create speed vs. time and acceleration vs. time graphs. Students create 24 graphs.
Curated OER
Position, Velocity & Acceleration vs. Time
For this motion worksheet, students use a graph showing the velocity of an object over time to describe the motion of the object and to determine the position of the object at different intervals. Then students create speed vs. time and...


