It's About Time
How Atoms Interact with Each Other
Connect the dots and assist young chemists as they demonstrate covalent and ionic bonding. Class members use their knowledge of valence electrons to predict compound formulas as they arrange electrons into various bonding structures...
Scholastic
Study Jams! Volume
Young mathematicians may solve for cubic units but do they know what that is? This video does a great job of visually explaining not only how to find cubic volume, but what it means in relatable terms.
Balanced Assessment
Rolling Coins
What caused the extra rotation? Class members visualize a coin rolling around the circumference of another coin. They determine the reason the rolling coin rotates twice. Further questions require them to determine a generalized formula...
EngageNY
Definition of Rotation and Basic Properties
Examine the process of rotating images to visualize effects of changes to them. The fifth lesson of 18 prompts pupils to rotate different images to various degrees of rotation. It pays special attention to rotations in multiples of 90...
Common Core Sheets
Comparing Visual Fractions
Introduce comparing fractions with a worksheet containing visual models. Young mathematicians must first identify the part being described in each model and then write greater than, less than, or equal to. Learners prepare to compare...
McGraw Hill
Kepler's Third Law Interactive
Common sense says that the farther a planet is from the sun, the longer the orbit. Kepler turned common sense into his third law by quantifying this relationship. Classes explore Kepler's Third Law through an interactive tutorial. They...
McGraw Hill
Eclipse Interactive
Give your classes a visual model of a rare phenomenon. Learners use an interactive activity to explore the connection of location, tilt, and size to the occurrence of an eclipse. Pupils consider both solar and lunar eclipses throughout...
CK-12 Foundation
Sum and Difference of Cubes: Stacking Blocks
Investigate polynomial factoring patterns by finding a connection to volume. As learners build a three-dimensional solid from smaller solids, they convert the visual model to a mathematical expression. Their models represent the sum of...
Prestwick House
"Because I could not stop for Death" -- Visualizing Meaning and Tone
Emily Dickinson's "Because I could not stop for Death" provides high schoolers with an opportunity to practice their critical thinking skills. They examine the images, diction, rhythm, and rhyme scheme the poet uses and consider how...
Chemistry Collective
Osmotic Pressure: Spontaneous Balloon Popping
Visualize osmosis using an interactive activity. As learners monitor a simulation, they witness the particle movement through the membrane. A balloon represents the cellular membrane and 'pops' as osmosis creates an imbalance of...
ReadWriteThink
A Picture's Worth a Thousand Words: From Image to Detailed Narrative
A picture's worth a thousand words—and even more inspiration! A visual activity uses photographs to inspire writers. The process teaches aspects of narrative writing, such as point of view and characterization.
Howard Hughes Medical Institute
Visualizing Gene-Expression Patterns
How do genetics gurus know so much about gene expression? See traits materialize before your very eyes using a presentation with embedded simulations. Science scholars develop an understanding of the techniques used to follow the work of...
Kenan Fellows
Saving Those Who Save Us: Exploring the Use of Sensors with Data Visualization
Sensor technology is amazingly accurate and useful. Combining the sensor technology and mathematical knowledge, scholars design experiments to answer a question they have developed. Questions may focus on light sensing, temperature...
University of California
The Civil War: Effects of the Civil War
Imagine being on the front line of the Civil War —from the front porch of your own house. Scholars use visual evidence from primary and secondary sources to analyze the impact of the Civil War on all Americans. They examine the research...
Common Sense Media
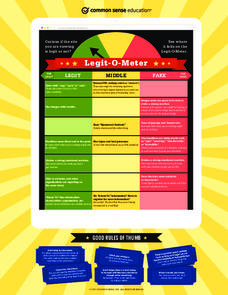
Legit-O-Meter
Pop-ups, banner ads, grammar mistakes ... these are all signs of an untrustworthy website. With the handy Legit-O-Meter poster, scholars can now double-check their sources to ensure accurate, reliable information. The color-coded poster...
San Diego County District Attorney
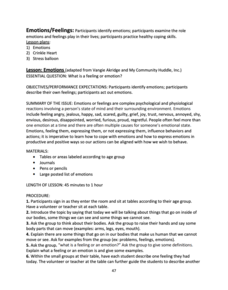
Emotions/Feelings
Three lessons delve deep into the topic of feelings and the importance of expressing one's emotions. Through grand conversation, hands-on learning experiences, and reflective writing, scholars interpret the ups and downs of everyday...
CK-12 Foundation
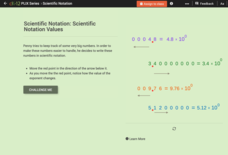
Scientific Notation Values
Scientific notation is the focus of a five-question interactive. A model with movable points offers a visual reference to help solve true or false, multiple-choice, and fill in the blank questions. A discussion question challenges...
Simon & Schuster
Classroom Activities for The Jungle by Upton Sinclair
A 15-page packet includes detailed plans for three activities related to Upton Sinclair's The Jungle. To gather background information, class members research topics and create a newspaper page reporting their findings. After finishing...
Curated OER
Visual Learning: Are You Really What You Wear?
Students analyze a photograph to complete a visual learning activity. For this visual learning lesson, students analyze the photograph and follow step process to identify the facts within the picture. Students analyze the photo caption...
Curated OER
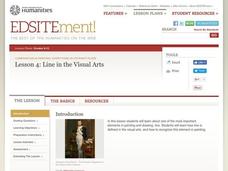
Follow the Leader: Line in the Visual Arts
Pupils identify line in the composition of a number of art works. They explain how the artist's compositional choices guide the viewer's eye to important components of the image. Students identify sight lines in several paintings and...
Curated OER
Numeric Patterns
In this numeric and visual patterns instructional activity, students continue the numeric and visual patterns given to them. Students are given 16 patterns.
AGSSS
World Regions
Help your learners to visualize where historical events have taken place around the globe with a map that details the major regions of the seven continents.
Curated OER
Poetry Coffeehouse
This resource contains a vague plan for a poetry unit conducted at an elementary school during the month of February. Although this plan does not included detailed instructional strategies, this does outline a basic unit, some creative...
Perkins School for the Blind
Friction
Friction is a force that can be felt, which means that learners with visual impairments can experiment to feel and understand the concept of friction. They slide a rock along a smooth table, and then they slide a rock across sandpaper,...
Other popular searches
- Visual Arts
- Visually Impaired
- Visual Art Self Portrait
- Visual Art Lesson Plans
- Teacher Resources Visual Art
- Visual Art Lessons
- Visual and Performing Arts
- Visual Art Lessons Symmetry
- Visual Discrimination
- Visual=art
- Visual Art Tessellations
- Visually Impaired Blind


