SeaWorld
How Big is a Blue?
Whales are all big, but some are larger than others! Kids will love sorting the 10 whale species by size at their desk (whale cut-outs provided). Next, use a whale rope to visualize how long each of these whales actually is. A large...
CoreCommonStandards.com
Common Core State Standards: Second Grade Workbook
You've hit the second grade Common Core jackpot! Find over 40 pages of curriculum designed specifically for the standards, both math and language arts. Printable versions of each standard can be used as learning displays, and...
Jamie York Press
Pythagorean Theorem Cutout Puzzle
If you'd like your lesson on the Pythagorean Theorem to be fun and engaging, check out a math puzzle activity for high schoolers. Your learners will enjoy this visual puzzle that shows how the Pythagorean Theorem works.
Safe Drinking Water Foundation
Types of Water Pollution
In groups, young environmentalists investigate water samples that are contaminated with different types of pollutants. Each group presents their findings to the class and fills out the "Types of Pollutants Chart." This lesson is meant...
Common Core Sheets
Finding Area by Tiling
Third graders find area by tiling a rectangle based on the given side lengths. This helps learners visualize and create the area of a figure. From here, they can count the total number of tiles inside the rectangle to find the answer.
Chemistry Teacher
Metals, Nonmetals, and Metalloids Lab
What an exciting way to introduce your blossoming chemists to the world of metals, nonmetals, metalloids, and polymers! Here is a lab activity that is designed to allow pupils the opportunity to visualize the reaction of metals,...
Virginia Department of Education
Cell Parts
What do a bird, an egg, a rabbit, and a toad all have in common? This fun-filled resource explains the similarities and differences between cells and how all cells are similar, yet all are different. Learners begin by depicting a...
Media Education Lab
Propaganda in Context
"Board Game Helps Fight Real World Ebola," a video produced by Voice of America, provides the text for a guided instructional activity that asks viewers to analyze the propaganda techniques used in the video. Groups then select a example...
GeoGebra
GeoGebra Graphing Calculator
So, exactly, what does it look like? The easily usable graphing calculator allows pupils to visualize the graph of equations and inequalities. The interactive supports any algebraic graph needed for high school mathematics and then some.
Academy of American Poets
Noticing Poetry
Introduce scholars to the "I Notice" method, a different approach to studying poetry. Instructors first model the noticing method by identifying words and images that appeal on the sonic level, the ideational level, the sensory level,...
Code.org
Discover a Data Story
"Data is so boring, there's no way to find any patterns in them." Or is there? Pairs investigate data sets using different data visualization tools to discover a trend that may exist in a data set. Once they find a trend or...
Curated OER
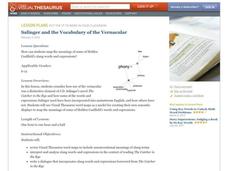
Salinger and the Vocabulary of the Vernacular
Writers explore vocabulary and expressions used in the English language. They use visual word maps to become aware of the different uses of words which will allow them to more readily interpret texts. Then they listen to/read excerpts...
Curated OER
Shared Reading and Writing with La Casa Adormecida
Write a book using Spanish vocabulary after listening to the book La Casa Adormecida. Learners identify known vocabulary, match vocabulary from the book with visuals, and unscramble syllables discover words. Learners write a new version...
Curated OER
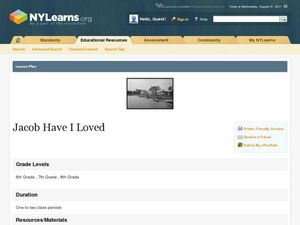
Jacob Have I Loved
Learners examine visual images about the novel, Jacob Have I Loved. They compare pictures from "America from the Great Depression to World War II" that are described in the book and other studies of the Chesapeake Bay. They present their...
Perkins School for the Blind
Testing the Strength of a Column
Columns have been used throughout the world because they are good load-bearing structures. Learners with visual impairments conduct an experiment to work through the design process as well as to understand this engineering phenomenon....
Novelinks
Wildwood Dancing: Guided Imagery
Reader's of Wildwood Dancing engage in a guided imagery exercise designed to encourage them to visualize the setting of Juliet Marillier's young adult fantasy novel.
Curated OER
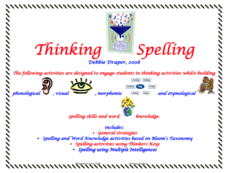
Thinking Spelling
An etymology resource is packed with suggestions for activities designed to build phonological, visual, morphemic, and etymological spelling skills.
Curated OER
Exploring the Expository Scenes in Macbeth
High schoolers examine the function of exposition in play structure. They will be able to develop multiple interpretations and visual and aural production choices for Shakespearean scenes and choose those that are most interesting.
NTTI
Transform Your Geometry into a Work of Art
Mathematicians utilize artwork to help illustrate the major ideas of transformations and tessellations. They visually identify transformations including reflections, rotations, and translations. They discuss how artists have used...
Curated OER
What's in the Time Capsule? A Technology-Connected Lesson Plan
Twelfth graders use computers and the Internet to research a specified area, word processors to prepare an essay, a digital camera, a video camera gather visuals, and a scanner to add visuals to a PowerPoint presentation as they discover...
Curated OER
Shades of Meaning
Examine and distinguish between words that have similar definitions but different connotations. Middle schoolers define connotation and denotation and participate in a "shades of meaning" contest in small groups. Groups use the...
K12 Reader
Making Predictions
Read efficiently and effectively with a passage about making predictions and using headlines and visual aids as clues. After kids read a few paragraphs in the passage, they answer five comprehension questions on the side of the page.
Curated OER
Use Culinary Concoctions to Illustrate Geological Events
Incorporating food into your science lesson helps learners to visualize and taste the complex concepts of Geology.
Fraction Bars
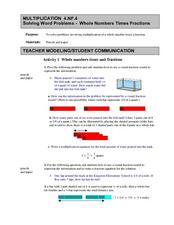
Solving Word Problems - Whole Numbers Times Fractions
An impressive lesson where pupils visualize models and solve problems involving multiplying a whole number times a fraction. Fraction bars are used to help learners truly understand what's happening during this mathematical process. The...
Other popular searches
- Visual Arts
- Visually Impaired
- Visual Art Self Portrait
- Visual Art Lesson Plans
- Teacher Resources Visual Art
- Visual Art Lessons
- Visual and Performing Arts
- Visual Art Lessons Symmetry
- Visual Discrimination
- Visual=art
- Visual Art Tessellations
- Visually Impaired Blind


