Virginia Department of Education
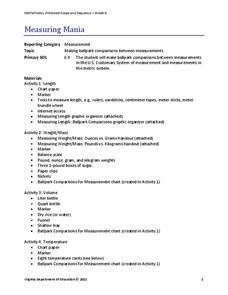
Measuring Mania
Conversion immersion — it's measuring mania! A set of four activities teaches scholars to convert between customary and metric units. Resource covers unit conversions in length, temperature, weight/mass, and volume.
Virginia Department of Education
What's the Point?
Point your class in the right direction in plotting points with three activities that give scholars a chance to learn about and practice plotting points on a coordinate plane. They draw figures on the coordinate plane and list out the...
Virginia Department of Education
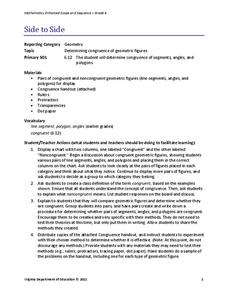
Side to Side
Congruent figures: two figures that want to be just like each other. Individuals learn to distinguish between figures that are congruent and those that are not. Measuring the lengths of line segments and angles helps in this endeavor.
Virginia Department of Education
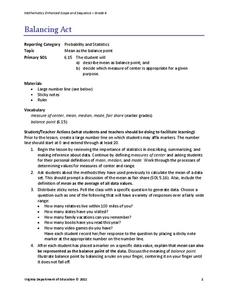
Balancing Act
How many different interpretations of the mean are there? Scholars place numbers on a number line and determine the mean. They interpret the mean as the average value and as the balance point.
Virginia Department of Education
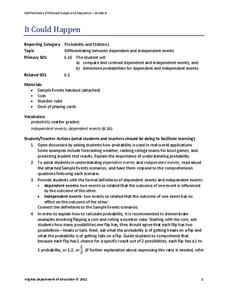
It Could Happen
Understanding of probability will probably increase with the use of a refined resource. Pupils learn to distinguish between dependent and independent events as they calculate the probabilities of these types of events in various...
Virginia Department of Education
Balanced
Bring balance to your lesson plans with an activity that asks individuals to solve one-step linear equations with inverse operations. Balance scales help learners understand the concept of isolating the variable.
Virginia Department of Education
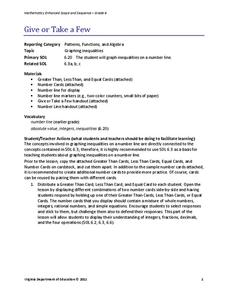
Give or Take a Few
Young mathematicians extend their knowledge of rational numbers on a number line to graph inequalities by first using number cards to compare rational numbers. They finish by using similar reasoning to graph inequalities on a number line.
Skyscraper Museum
Building a Skyscraper
Creating buildings that reach hundreds of feet into the sky is no easy task. The third instructional activity in this series begins with four activities that engage young architects in exploring the major challenges that are faced when...
Edinburgh UNESCO City of Literature Trust
The Lost World
Fans of Sherlock Holmes may be surprised to learn that in addition to stories of the famous deductionist, Sir Arthur Conan Doyle is also the creator of Professor Challenger. An irascible, unpredictable scientist, Challenger was featured...
Teach Engineering
May the Force Be With You: Drag
Do not let friction drag you down! The 11th segment in a series of 22 focuses on the fourth force acting upon an airplane—drag. Pupils learn about the effects and causes of drag.
Curated OER
English Exercises: Prepositions Exercises - Advanced Vocabulary - Collocations and Connectors
In this preposition exercises interactive activity, students complete 36 sentences using the drop down menus. They insert words that show expressions of time, reasons, words of addition, contrast, conclusion, and possibility. They click...
Curated OER
Euler's Method Introduction
Young mathematicians define and use Euler's method to solve problems in this calculus lesson. Learners visualize graphs and solve differential equations. They create these visuals on the TI calculator.
Curated OER
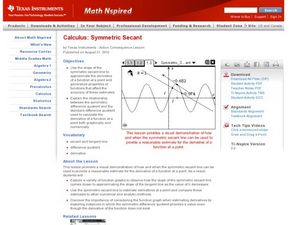
Symmetric Secant
Mathematicians use a symmetric secant line to prove the derivative at a point. In this trigonometry activity, students create secant lines on the navigator to analyze the derivative. They move the lines around and make observations.
Curated OER
The Great Cookie Company
Fourth graders implement real life application of money, problem solving, economics, and consumer awareness. In this three week economics unit, 4th graders operate a business, write checks, balance accounts, and market their...
Curated OER
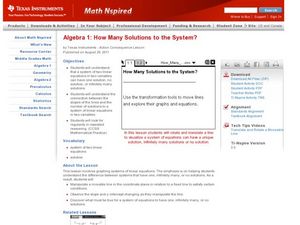
How Many Solutions to the System?
Solve systems of equation using graphing! In this algebra lesson, students use the TI to graph two lines and identify the number of solutions. They perform interactive graphing on the navigator.
Curated OER
Transformations of Functions 2
Solving problems on the TI graphing calculator can be quite easy. Young scholars observe the properties of transformation of functions and create a formula for the transformation.
Curated OER
Exponential vs. Power
Pupils differentiate between exponential and power functions. They identify the base, exponent and properties of exponential functions. They also graph the functions using the TI calculator.
Curated OER
Sieve of Eratosthenes
Students discover the Sieve of Erathosthenes. They explore a method to find all the prime numbers in a group of numbers. Using models, students practice divisibility rules while examining the difference between prime and composite numbers.
Curated OER
Geometry of Triangles Using a Protractor
Seventh graders use a protractor to measure angles and solve a problem involving distance. For this measuring angles with a protractor lesson plan, 7th graders calculate the distance of a line on a diagram by using a protractor to...
Curated OER
Making an Edible Coral Polyp
Students study anatomy. In this coral reef lesson, students recreate the anatomy of a coral polyp using edible materials. They work in pairs following step-by-step instructions given by the teacher. This lesson includes a list of...
Curated OER
Identifying Faces, Edges, and Vertices
Fourth graders examine faces, edges, and vertices. In this geometry lesson, 4th graders participate in classroom activities that require them to compare geometric shapes, figures, and models.
Curated OER
Math Made Easy
Students evaluate word problems. For this problem solving lesson, students are presented with word problems requiring graphing skills and students work independently to solve.
Curated OER
Introduction to Representing and Analyzing Data
Represent data graphically. Allow your class to explore different methods of representing data. They create foldables, sing songs, and play a dice game to reinforce the measures of central tendency.
Alabama Learning Exchange
How Big Can a Bee Be?
Mathematicians analyze the relationships between surface area and volume. They conduct Internet research, conduct various experiments, record the data in a spreadsheet, and graph the results and compare the rate of increase of surface...


