National Wildlife Federation
Ghost Town
Around 93 percent of the reefs on Australia's Great Barrier Reef have been bleached, and almost one quarter of them are now dead. Scholars research the sea temperatures, especially around the areas with coral reefs, to make connections...
Curated OER
Dissolved Oxygen and Respiration
Students are presented with the question, "Do plants that grow underwater use oxygen?" They create an experiment to test the presence of dissolved oxygen in the water using provided materials. Student experiments include a control jar as...
Curated OER
Tides in the Hudson
Students view an illustration of the Hudson River watershed and identify the bodies of water shown. They discuss what happens when fresh and salt water mix. Students view a teacher demonstration of the stratification of fresh and salt...
Curated OER
Keep Away
Study biological diversity by analyzing given data, and make inferences about the possible effects of oil drilling operations on specific benthic communities. This lesson allows students to use their statistical analysis skills asweel as...
University of Wisconsin
Designing a Rain Garden
Now it's time for all of the data collected in previous lessons to be applied to the design of a rain garden. This resource can only be used as part of the greater whole, since learners will need to rely on gathered knowledge in order to...
Japan Society
Nature and the Environment in Postwar Japan
Japan has a complex relationship with the environment. Explore this relationship with your class through this resource. Included are thought questions, several activity ideas that range from writing, to discussion, to research, and an...
Georgia Aquarium
The Ocean's Nursery
Linear perspective, estuaries, and water ways converge in a science-inspired art project. The class uses what they've learned about eco-systems, estuaries, and the food chain to create scale models of a local marsh. While the lesson is...
Curated OER
Fall 1-The Rain Forest Biome and the Effects of Acid Rain - Biology Teaching Thesis
Students explain why rain forests have great biodiversity, and list each layer of a rain forest and tell an organism that lives in each. They identify the cause of acid rain and its affect on a rain forest. Students hypothesize the...
Curated OER
The Chemistry of Refining Crude Oil
Consider our energy sources: wood, coal, oil, uranium. Learners compare the pollution to energy produced for each. They practice fractional distillation of an alcohol/water mixture to simulate the process of refining crude oil....
University of Wisconsin
Sizing a Rain Garden
Most appropriate if you are applying the entire unit to build a rain garden at your school, this installment involves calculating the area that will drain into it. Your garden planners will need data from previous lessons, so this one...
Curated OER
"Tri-County" Project--Well in a Cup
Students construct a model of a well to identify how water is brought to the surface. Signs of pollution are investigated.
Curated OER
"Tri-County" Project--Ogallala Aquifer
Students explore the Ogallala Aquifer in the state of Nebraska. The signs of pollution found are examined and the data classified.
Curated OER
Current Events and Fish
Fifth graders examine current events impacting aquatic life in their communities. They search for newspaper, magazine and television reports for information about aquatic life in local bodies of water. Students can write letters to...
Curated OER
What's Hiding in the Air?
Fifth graders conduct experiments to study the effects of invisible air pollutants including one with a bean plant. They examine methods of invisible air pollutants.
Curated OER
Particulate Matter: The Lorax
Students collect air samples to test it for air pollution. They are read the story The Lorax and discuss the effects of air pollution. They share their observations with the class.
Curated OER
The Effect of Automobile Exhaust on Hydra in an Environmental Chamber
Pupils study the structure and habitat of the hydra in this lab lesson. Students determine if the hydra can be used as an indicator to detect pollution from automobile exhaust.
Curated OER
CO Buildup City
Students conduct a controlled experiment. They collect data in an organized manner. Students analyze data to reach a conclusion and communicate findings. They explain how city size, temperature, and pollution is related to the air quality.
Curated OER
Acid Rain Keeps Falling on My Head
Students examine the pH level of rain water in their local community. They locate each location on a map. They analyze the data and draw conclusions.
Curated OER
This Stuff Makes Me Sick
Students participate in a lab showing the effects of pesticides on Lumbriculus variegatus. Several extensions and variations are also included in this lesson including one which relates the experiment to how pesticides enter our drinking...
Curated OER
Fallout!
Students plot the locations of fallout from two disasters that polluted much of the world's air. They plot the ash fallout from the 1980 Mt. St. Helen's eruption to see what the wind patterns in the United States look like overall. Next...
Curated OER
The Effect of Medications on Daphnia
High schoolers explore how human beings affect the world's ecosystem by examining the affects of medication on daphnia, a small freshwater organism very sensitive to pollution. Students use a computer model to repeat the experiment and...
Curated OER
Environmental Education
Second graders examine how their choices affect the environment. They identify different types of pollution and its source. They ask questions to end the lesson.
Curated OER
NCTA Lesson Plan on China
Students identify China's geography, especially arable land, rainfall, crop growing areas, rivers, and mountains. Students select a technological advance to draw a diagram of the particular advance make transparencies of the diagram,...
Curated OER
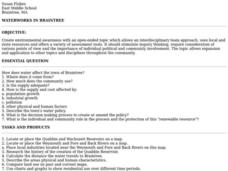
Waterworks In Braintree
Students examine how water affects the community of Braintree. Using a map, they locate main resevoirs and rivers in the area and research the history of one of the resevoirs. They use charts and graphs to show how land use has changed...


