TeachEngineering
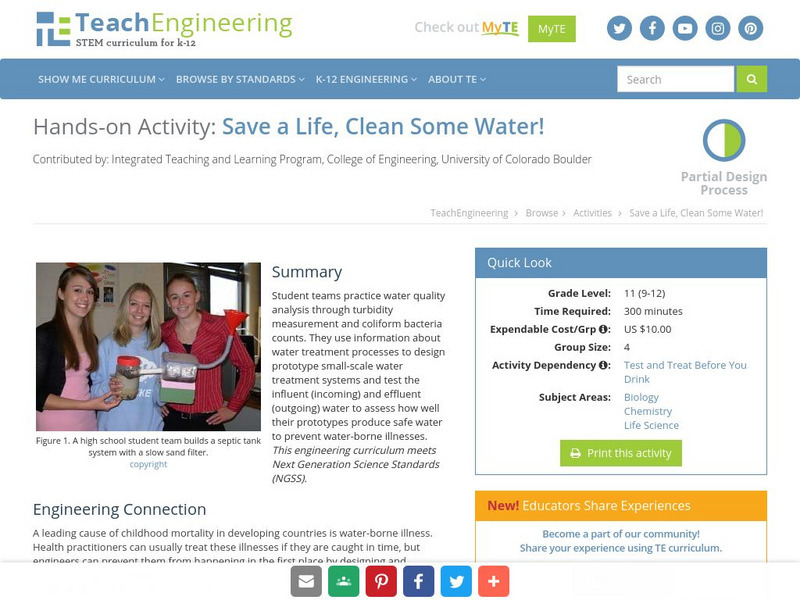
Teach Engineering: Save a Life, Clean Some Water!
Student teams practice water quality analysis through turbidity measurement and coliform bacteria counts. They use information about water treatment processes to design prototype small-scale water treatment systems and test the influent...
Science Education Resource Center at Carleton College
Serc: Investigating the Water Quality of the Root River in Lanesboro, Mn
This field investigation will be in collaboration with Eagle Bluff Environmental Learning Center in Lanesboro, MN link to Eagle Bluff. It will include chemical, biological, and physical tests. The chemical tests will include kits where...
US Geological Survey
Usgs: Water Quality of San Francisco Bay
This resource from the United State Geological Survey provides data about San Francisco Bay's water quality. Data is displayed in time series plots, vertical profiles, longitudinal sections, space and time contours, and x-y scatter plots.
Science Education Resource Center at Carleton College
Serc: Investigating Water Quality Through Quantative and Qualitative Analysis
By looking at the bottom dwelling macroinvertebrates, students will investigate water quality and habitat quality in this field lab. Students will record the number of creatures found at the bottom of a pond, lake, ditch, stream or river...
Other
Bscs: Asking and Answering Questions With Data
In this self-directed lesson, students use graphs and maps of water quality to investigate relationships between variables to answer questions. A handout with everything the student needs to complete this lesson is available as a PDF or...
NOAA
Noaa: Chesapeake Bay Interpretive Buoy System: Data in the Classroom
NOAA Smart Buoys collect and transmit real-time weather, water conditions, and water quality data. Chesapeake Exploration gives teachers and their students unprecedented access to lessons designed around real-time observational data from...
US Geological Survey
U.s. Geological Survey: Water Resources of the United States
Visit the U.S. Geological Survey's website for a wide variety of information on water. Content includes data on water quality, water use, acid rain, among others; publications; information on water resource programs; maps; information on...
NOAA
Noaa: Estuaries: Noaa: Science Data: Graphing
Create graphs of marine ecosystems using real-time data.
Nature Conservancy
The Nature Conservancy: Gardens Activity Guide: Water
In this guide helps students understand their garden as a model watershed through the collection and analysis of rainwater filtration data.[4.06]
BSCS Science Learning
Bscs: Asking and Answering Questions With Data
This inquiry is intended to provide students with practice developing investigable questions that need data, and specifically large datasets, to be answered. Click the teacher resources link for teaching guides and student handouts.
Science Education Resource Center at Carleton College
Serc: Mn Step: Water Quality
After observing the local aquatic environment and testing the water quality, students formulate a testable hypothesis. They next choose a second location, collect samples to bring to school, and test the water quality. Data is organized...
Other
Epa New England: Long Island Sound Facts, Figures, and Maps
Listing of various fact sheets created and published through the Long Island Sound Study. Topics include How Low Dissolved Oxygen Conditions Affect Marine Life in LI, Impact of Atmospheric Nitrogen Deposition on Long Island Sound, Sound...
NOAA
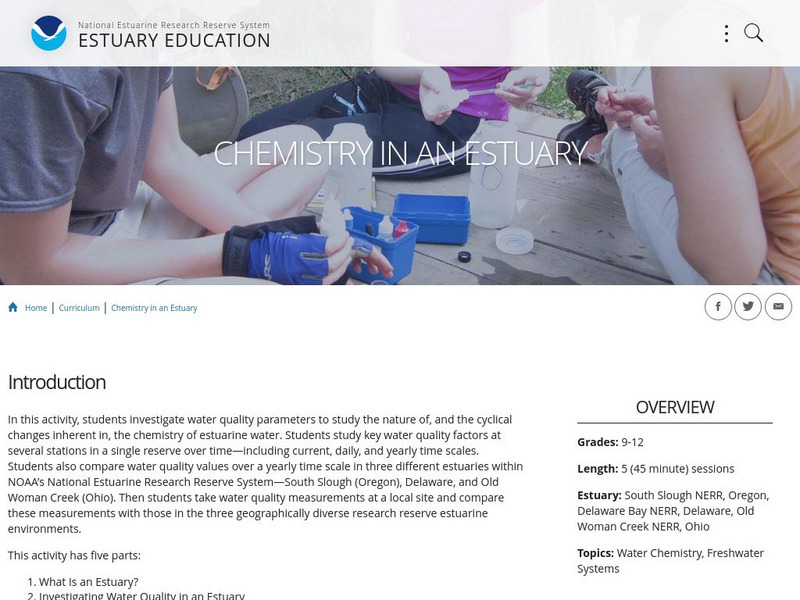
Noaa: Estuaries 101 Curriculum: Chemistry in an Estuary
This activity introduces students to the complex chemistry of estuarine water. Students investigate how chemical and physical water quality factors-pH, temperature, dissolved oxygen, and salinity-change and interact over varying time...
TeachEngineering
Teach Engineering: Should I Drink That?
Students perform the first steps that environmental engineers do to determine water quality - sampling and analysis. Student teams measure the electrical conductivity of four water samples using teacher-made LED conductivity testers and...
Science Education Resource Center at Carleton College
Serc: Investigating Ponds and Streams: How Clean Is Our Water?
In this field lab, students investigate the differences in three city ponds. Students will compare pond life, temperature, pH, Ammonia, dissolved oxygen, and Nitrate. The student use the pond sheets (Flinn Scientific Catalog 2007) to...
Science Education Resource Center at Carleton College
Serc: Coupled Plasma Mass Spectrometer to Teach About Water Chemistry
In this lesson plan learners will use data acquired with an ICP-MS to teach them about water chemistry at a variety of levels.
Columbia University
Nasa: Sedac: Health and the Environment
[Free Registration/Login Required] A collection of twenty-three data sets from SEDAC (Socioeconomic Data and Applications Center) that examine health issues and how the environment impacts health in areas around the globe. They look at a...
Columbia University
Nasa: Sedac: Marine and Coastal Regions and Sea Level Rise
[Free Registration/Login Required] A collection of fifteen data sets from SEDAC (Socioeconomic Data and Applications Center) that examine the impact rising sea levels is having on marine and coastal regions. They look at mangrove...
Other
Icpdr: Ships and Environment to Share Danube River
This is a comprehensive analysis of the importance of the Danube River Basin and ways to balance human and ecological needs in the basin. The reason behind this study is the European Union's move to open shipping lanes in the Danube and...
Science Buddies
Science Buddies: Harmful Algal Blooms in the Chesapeake Bay
Harmful algal blooms occur when algae, which form the base of the ocean food web, grow in massive numbers and produce toxic or harmful effects on people, fish, shellfish, marine mammals, and birds. In this project you will learn how to...
Science Education Resource Center at Carleton College
Serc: Mn Step: Who Wants to Live Here? Water Sampling at Local Pond and Stream
The water quality at a local pond or stream is tested, and examined for organisms. Students record their data and observations and analyze the information. A pH chart showing what aquatic organisms can live at different pH levels is...
Center for Innovation in Engineering and Science Education, Stevens Institute of Technology
Ciese: Collaborative Projects
Using a variety of science topics, these projects link your class with classes around the world in data collection and analysis. There are projects recommended for all grade levels. Begin dates and end dates are listed to help in...
Science Buddies
Science Buddies: It's Raining, It's Pouring: Chemical Analysis of Rainwater
Here is an interesting project that could be approached from several different scientific angles: Environmental Science, Weather & Atmosphere, Chemistry, or Plant Biology. You can probably think of your own variations to emphasize...
Science Education Resource Center at Carleton College
Serc: Nitrate Levels in the Rock Creek Park Watershed: Meas of Central Tendency
Activity uses water-quality data from Rock Creek Park to illustrate elementary statistical measures of exploratory data analysis. The focus of the lesson is the nutrient limitation in a stream and the three measures of central tendency.


