Curated OER
Technology Integration Lesson Plan: Music Database
Eighth graders gather information on fifteen of their favorite songs, create database with fields representing different attributes, explore and sort their databases, and create charts and graphs showing amount of play time vs. popularity.
Curated OER
Study of an Artist
Fourth graders research an artist, write a short report and do an oral presentation.
Curated OER
Graphing Regions: Lesson 2
Students identify and analyze geographical locations of inventors. They each identify where their inventor is from on a U.S. map, discuss geographic patterns, and create a t-chart and graph using the Graph Club 2.0 Software.
Curated OER
Student Costs Graph
Students calculate the mileage, gasoline costs, and travel time and costs for a vacation. They conduct a virtual field trip, and create a comparison graph of costs using Microsoft Excel software.
Curated OER
Cafeteria Mayhem
Young scholars design a cafeteria floor plan. In this area and perimeter instructional activity, groups create an efficient lunchroom layout on poster board by using geometric shapes and formulas as the basis for their designs. In the...
Curated OER
Leap Into Exponential Functions
Studens identify the properties of exponents. In this algebra lesson, students grapha nd solve equaitons of exponential functions. They add, subtract, multiply and divide using exponents.
Curated OER
Technology vs. Nontechnology
Fourth graders determine the range, mean, median and mode using a computer spreadsheet. An identical set of calculations is done without using a computer. The results of each method are compared. They calculate the mode, median and range...
Curated OER
Indians of the Plains
Second graders, in groups, explore the Plains Indians and explore how the physical climate of the Plains region affected their lives.
Curated OER
Centimeter Slinkies
Third graders estimate and measure the length of a whole color-segmented, candy gummy worm. Then, as students bite off each segment, they estimate, measure and record findings in an activity log.
Curated OER
The Seminoles
Young scholars explore the Southeast Woodland region and culture of the Seminole Indians using video, art projects, books, maps and discussion.
Curated OER
Suburban Ecosystems
Students conduct simple sampling of plant and insect biodiversity at ground level in two contrasting environments of their own choosing. They recognize and record different species then compare and contrast species numbers in the two...
Curated OER
Light Is Amazing
Students investigate light and its energy. They discuss the properties of light, research how much light the moon absorbed on their birthday on a website, complete a graphic organizer, and create a kaleidoscope.
Curated OER
Eco the Gecko and the Story of Economics
Second graders explore the basic concepts of economics through a puppet called Eco the Gecko.
Curated OER
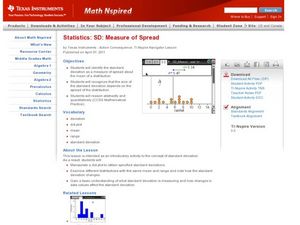
Measure of Spread
Students identify the standard deviation. In this statistics lesson, students find the mean distribution and calculate the percent of deviation from the mean. They observe this change on the Ti calculator.
Curated OER
"Slice of Pi with Neo-Excel"
Students explore diameter, radius, and circumference. They define radius, diameter, and circumference on an online dictionary, identify objects in the room with a radius and a diameter, and calculate the radius and diameter of various...
Curated OER
Geographic Information Systems
Young scholars examine the concept of geographic information systems (GIS) and its basic components. They explore an application program using GIS technology and list the various uses for GIS.
Curated OER
Animal Investigation
Third graders gather information and classify animals. In this animal investigation lesson, 3rd graders research animals, and organize the information into notebook.
Curated OER
Geo Jammin' By DeSign - Day 6, Lesson 32: Appliqué-tion of Learning
Second graders hand stitch three different appliqué stitches using triangles as a motif.
Curated OER
Geo Jammin' By DeSign - Day 5, Lesson 28: The Mo-tea-if
Second graders explore tea dyeing cloth.
Curated OER
Flying Geese
Students examine the Flying Geese quilt pattern, and discuss and identify the pattern. They write a paragraph titled, My Quilt Report, summarizing the information discussed about the quilt patterns.
Curated OER
Slopes and Linear Equations
Young scholars find the slopes of linear functions. In this graphing instructional activity, students analyze linear equations and calculate the slope of the line. They graph a line given the slope and y-intercept.
Curated OER
Acids and Bases - Vinegar II
Eighth graders experiment what happens when acids and bases are mixed together. In this acids and bases experimental lesson, 8th graders decide which of three solutions of unknown pH will neutralize a fourth solution of unknown pH.
Curated OER
Green Leaves
Third graders, after having conducted one experiment three times, record their observations results in a chart. They predict what hidden colors they believe that a leaf holds. Students record their predictions in their science note books...
Curated OER
Our Favorite Pet
Students each have a turn, telling the class his or her favorite pet. The choices are cat, dog, fish or bird. Using the computer, the information from the tally be recorded on a spreadsheet and bar graph.


