Curated OER
Our Favorite Pet
Students each have a turn, telling the class his or her favorite pet. The choices are cat, dog, fish or bird. Using the computer, the information from the tally be recorded on a spreadsheet and bar graph.
Curated OER
Definition and Applications of Computational Science
Students participate in a variety of instructional experiences about Computer Science. They define Computational Science and describe computational simulation. They also compare and contrast Computational Science and Computer Science.
Curated OER
Geo Jammin' By DeSign - Day 3, Lesson 12: Jammin
Learners review definitions of word wall words using songs, movement and sharing.
Curated OER
Geo Jammin' By DeSign - Day 1, Lesson 6: Quilt Story
Learners recognize that quilts are created by geometric components. They examine how quilts are an artistic art form that show the cultural heritage of the people who make them.
Curated OER
Geo Jammin' By DeSign - Day 7, Lesson 36: DeSign Sampler
Second graders, in groups, write quilt reports.
Curated OER
The Matrix
Second graders compare and contrast groups of Native Americans and culture groups from different regions and times.
Curated OER
Got Biodiversity?
Students examine the concept of biodiversity. Using the internet, they complete small activities in which they work together. Using the information they collected, they create a class book, make murals and write in their journals.
Curated OER
Rocks and Minerals Composition Database
Fourth graders research a specific rock or mineral. They compile the facts into a database which students access for information.
Curated OER
A Poster is Worth a Thousand Words
High schoolers list observations of PSA posters. They provide evidence/examples of their observations through class discussion. Students explore public health posters. They investigate historical public health campaign posters.
Texas Education Agency
Texas Gateway: Data, Sampling, and Variation in Data and Sampling
This learning module discusses quantitative and qualitative data, the use of two-way tables in marginal and conditional distributions, how to display data, variation in data and samples, and how to critically evaluate statistical...
National Council of Teachers of Mathematics
Nctm: Illuminations: State Data Map
Data can be displayed in a variety of ways. This interactive map of the United States shows data by degrees of color. Choose to display data such as: land area, population, population density, gas use, and much more.
US Environmental Protection Agency
Epa: Air Data
The AirData website gives you access to air quality data collected at outdoor monitors across the United States, Puerto Rico, and the U. S. Virgin Islands. The data comes primarily from the AQS (Air Quality System) database. You can...
Khan Academy
Khan Academy: Picture Graphs (Pictographs) Review
Picture graphs are a fun way to display data. This article reviews how to create and read picture graphs (also called pictographs).
CK-12 Foundation
Ck 12: Statistics: Displaying Categorical Variables
[Free Registration/Login may be required to access all resource tools.] This Concept covers a few ways in which categorical data can be displayed; using bar graphs and pie graphs.
Math Is Fun
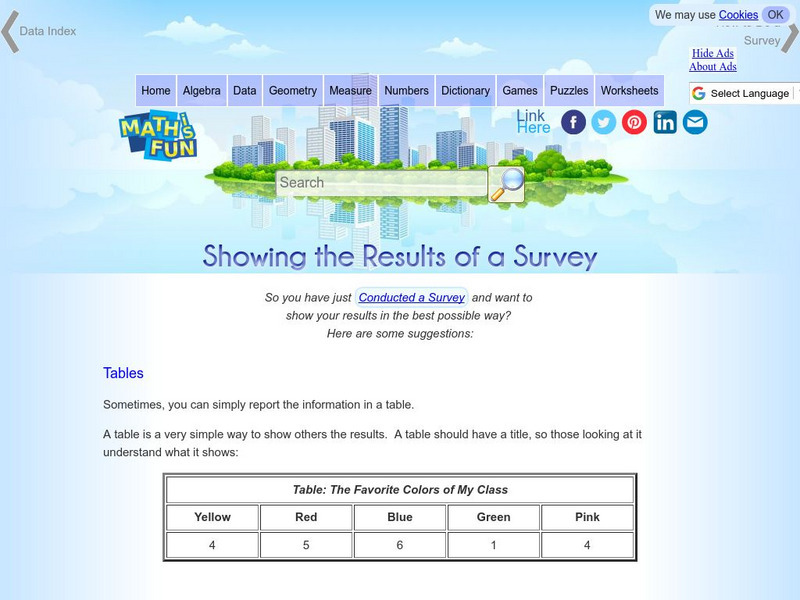
Math Is Fun: Showing the Results of a Survey
A variety of ways to display the results of a survey are listed, including tables, statistics and different types of graphs.
TED Talks
Ted: Ted Ed: Hans Rosling Shows the Best Stats You've Ever Seen
Explore collected data in regards to life expectancies, family size, and finances through out the world and the various ways the data has been displayed.
TeachEngineering
Teach Engineering: Spectroscopy
Students learn how using a spectrograph helps us understand the composition of light sources. Using simple materials and holographic diffraction gratings (available online at a variety of sites, including Edmund Scientifics and the...
Google
Google Maps: Virtual Tour of Pergamon Museum, Berlin
Take a virtual tour through the Pergamon Museum located on Museum Island in Berlin. This world famous museum has life-size, reconstructed monuments from ancient civilizations, including the Pergamon Altar of Zeus, the Roman Market Gate...


