Curated OER
Collecting Data
In this data collection activity, students read about how data is collected and organized. They also learn about a hypothesis. Students read through examples of different charts and then answer 23 questions pertaining to data collection....
Weather Bug
WeatherBug
Exploring the weather has never been more intriguing! Whether you are looking for a quick glance at the 10-day forecast, trying to figure out if lightning is heading your way, or wondering what the pollen count is, you will find out...
Curated OER
Sound Busters
Fourth graders engage in a study of sound pollution at their school. After a class discussion on what noise pollution is, learners are asked if they think there are areas of their school or community where noise pollution is a problem....
College Board
2005 AP® Statistics Free-Response Questions
A little context will go a long way. The six released free-response questions from the 2005 exam, show how AP® Statistics uses context within their problems. Pupils use the questions to practice their statistics skills within real-world...
Super Duper Publications
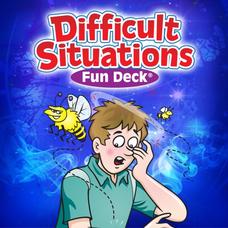
Difficult Situations Fun Deck
What would you do? Fifty-six illustrated picture flash cards provide players with an opportunity to talk about difficult situations, practice responses to awkward or uncomfortable situations, and consider how to deal with dangerous...
Curated OER
Asthma Survey
Students collect survey data on the prevalence of asthma in a community. They summarize and display the survey data in ways that show meaning.
Curated OER
Introduction to Graphs: Bar Graphs, Line Graphs, Circle Graphs
In this graphing data worksheet, middle schoolers answer 5 short answer questions about graphs. Students determine which type of graph best represents various data sets.
Curated OER
Logarithmic Transformations of Data
Students investigate and study logarithmic equations. In this precalculus lesson, students analyze the data behind the function. They define each graph as positive, negative or no correlation. They find the line of best fit.
Curated OER
Using Artifacts to Engage Students in Critical Thinking Activities
Creating learning centers with artifact-related activities are a great way to promote deductive reasoning and critical thinking skills.
Kenan Fellows
Reaction Stoichiometry—How Can We Make Chalk?
What is a reasonable percent yield in the manufacturing process? Scholars develop a process for producing chalk in the third lesson of a six-part series. Then, they must determine the theoretical and percent yield. Discussions about...
Curated OER
Weather "Whys"
Students complete activities to explore fall weather. In this weather lesson, students use the given links to examine weather forecasts. Students complete a weather graph activity and watch Internet field trips. Students complete fall...
Curated OER
Cloudy vs. Clear
Students analyze line plots. In this weather instructional activity using real NASA data, students discuss how weather affects the way the Earth is heated by comparing different line plots.
Curated OER
Height versus Shoe Size
Students find a correlation between a person's height and his/her shoe size. They have access to entering data into lists on a graphing calculator and can complete scatter plots. Students read and interpret a scatter plot and use the...
Virginia Department of Education
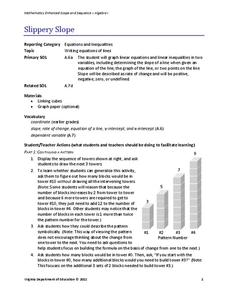
Slippery Slope
Explore slope using geometric patterns. Young mathematicians investigate towers built from cubes to develop a linear pattern. They move the data to a coordinate plane to connect the pattern to slopes.
Curated OER
How High Are the Clouds?
Students analyze height and collect data to create a graph. In this statistics lesson, students use central tendencies to analyze their data and make predictions. They apply concept of statistics to other areas of academics to make a...
Curated OER
When the Snow is as High as an Elephant
High schoolers study the concept of mean values using a data plot. Learners enter the given data in the activity to create their data table. They use the data table to calculate the mean of the snowfall percentage provided in the...
Curated OER
Data Shuffle
Students find an advertisement or newspaper using charts or graphs. They create another graph using the same information in a different format. They write a comparison of the two graphs.
Curated OER
Exploring Renewable Energy Through Graphs and Statistics
Ninth graders identify different sources of renewable and nonrenewable energy. In this math lesson, learners calculate their own carbon footprint based on the carbon dioxide they create daily. They use statistics to analyze data on power...
Curated OER
Great Tasting Shapes
Fifth graders investigate the concept of median, mode, and range using a simple model for display purposes. They examine different shaped crackers out of a box and identify the ones that occur the most. Then the calculations for the...
Curated OER
Telling Time to 5 Minutes
In this second grade lesson your class will practice telling time. The goal is to tell time to five minutes using an analog clock. Your young students count by 5 minute intervals and discuss elapsed time.
Curated OER
Electricity--More Power to Ya!
Fourth graders use research tools to access and synthesize information. They gather and manipulate data using technology. Research and study the components of an electrical circuit. Create a brochure that demonstrates knowledge of how to...
Texas Instruments
Light and Day
Pupils explore the concept of collecting data as they collect data on their graphing calculator about time, temperature, and light. Learners plot the data and create histograms and box and whisker plots to analyze the data.
Curated OER
Out of this World: Inquiry-Based Teaching
Connect classroom learning with real-life experiences by using photographs and data taken by the Mars Pathfinder.
Curated OER
Investigating Factors That Affect Cell Membrane Permeability
Cell membranes and the factors that affect its integrity are studied, with Beet tissue used as the model. A poster to display findings of the permeability of the membranes would clarify understanding and also allow a layer of language...


