Curated OER
How Big Is Your Head?
Learners explore measurement by measuring classmates' heads. They record their measurements and they put the measurements in order from smallest to largest. Students figure the mean, median, mode, maximum, minimum, and range of their...
Curated OER
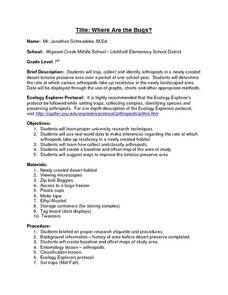
Where Are the Bugs?
Students trap, collect and identify arthropods in a newly created desert tortoise preserve area over a period of one school year. They determine the rate at which various arthropods take up residence in the newly landscaped area. Data is...
Clean Up Australia
Why are Batteries Harmful to the Environment?
Open this lesson by reading together about primary and secondary batteries (such as nickel-cadmium cells), problems they can cause in the environment, and how humans can minimize the damage. Afterward, little ones examine a collection of...
Curated OER
Pizza Possibilities
Middle schoolers create and interpret line plots, bar graphs, and circle graphs. The lesson assumes mastery of conversions from fraction to decimal to percent, construction of angles, and at least an introduction to graphs displaying data.
Curated OER
Coin-a-copia: A Thanksgiving Glyph Activity
Students explore glyphs that are pictorial representations of data. Students collect and display data about themselves and a variety of other topics. Students practice using a legend to analyze and interpret data.
Curated OER
Probability
Students investigate probability. For this fourth through sixth grade mathematics lesson, students collect, organize and display data in an appropriate chart or graph as they calculate and apply basic probability.
Curated OER
Young Voters Make A Difference
Students research recent statistics on voting by those 18 to 24. They survey senior students to determine their intent to vote in the next election. Students display the data in charts and graphs. They write the results and share it with...
Curated OER
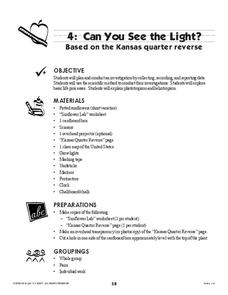
Can You See the Light?
Explore plants and flowers with this lesson. Learners talk about plants, conduct an experiment with suflowers, and track a plants growth. This is a motivating way to present this concept.
Curated OER
Important Contributions to American Culture
Fifth graders explore the contributions of different cultures to the American landscape. Students work in groups and use a variety of resources to create a presentation about a group that emigrated to America.
Curated OER
Math Made Easy
Students evaluate word problems. In this problem solving lesson, students are presented with word problems requiring graphing skills and students work independently to solve.
Curated OER
Environmental Graphing
Young scholars experiment with graphing. In this graphing introduction lesson plan, students complete four activities: 1) a bar graph based on class birthdays 2) an estimation graph of the raisins in raisin bread 3) another estimation...
Curated OER
Super Spreadsheets
Middle schoolers discover information about each of the fifty states in the United States. In groups, they create a spreadsheet organizing the information to show to the class. They discover different ways to display the data and...
Curated OER
My Favorite Birthday
Learners collect and organize data from classmates, display data on simple chart, and plan class birthday party.
Curated OER
Food Pyramid - Daily Diet Diary
Students keep a daily diet diary and discuss the Food Pyramid. They investigate other geometric shapes as a way to display daily food guidelines. In groups, they design a menu for the Food Pyramid Restaurant.
Population Connection
The Human-Made Landscape
Agriculture, deforestation, and urbanization. How have human's changed the planet and how might we mitigate the effects of human activity on the planet? To answer these questions class members research the changes in human land use from...
EngageNY
Patterns in Scatter Plots
Class members investigate relationships between two variables in the seventh installment of a 16-part module that teaches scholars how to find and describe patterns in scatter plots. Young mathematicians consider linear/nonlinear...
Code.org
Canvas and Arrays in Apps
Scholars learn how to make a digital canvas and fill it with artwork by creating a drawing app using the canvas element. The activity requires learners to previous knowledge of arrays and return commands to draw images.
Missouri Department of Elementary
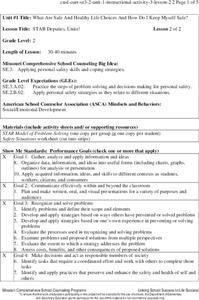
STAR Deputies, Unite!
STAR deputies unite! Scholars gather in small groups to solve problems using the STAR method. Pupils read a card that describes a situation that requires problem-solving. They role-play the scenario in front of their peers.
Missouri Department of Elementary
Opportunity Knocks, But It Costs, Too!
Sixth graders practice six steps to effective problem solving. Working with the school counselor, class members are presented with a scenario that requires them to make a decision. Individuals then write a reflection in which they...
02 x 02 Worksheets
Inverse Variation
Discover an inverse variation pattern. A simple lesson plan design allows learners to explore a nonlinear pattern. Scholars analyze a distance, speed, and time relationship through tables and graphs. Eventually, they write an equation to...
Teacher Created Materials
The Tragedy of Julius Caesar
Bring Julius Caesar to life with a reader's theatre approach that engages the entire class. The opening exercises model the importance of reading with expression while choral reading exercises permit class members to practice their...
Curated OER
Names Count!
Second graders work in small groups to complete a graph and use data to determine range, mode, and median. They use the number of letters in their names and in fairy tale characters names to produce their data. This is a fun lesson!
Curated OER
Math TODAY - Breast Cancer Risks
Learners explore data that be modeled by a logistic function. They have the opportunity to study real-life data and create a mathematical function to model the data and make a prediction.


