Curated OER
Telling Time to 5 Minutes
Learners take part in various activities ranging from creating a human clock, to small group problem solving to reinforce the concept of telling time accurately to five minutes on an analog clock.
Multiverse
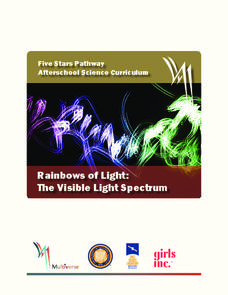
Rainbows of Light: The Visible Light Spectrum
Rainbows can teach us about the visible light spectrum. Learners observe multiple items that clearly display a rainbow to develop better connections. The lesson then explains wavelength using a rope to make waves.
Curated OER
Reflection/Evaluation
Learners practice the skills of reflection and evaluation. In this reflection lesson, students are grouped together and asked to brainstorm what they have learned during a particular unit. Learners decide what they want to share with the...
Curated OER
Volume, Mass, and Weight
Study the difference between mass and weight. Your math group will compare the weight of an item to the amount of space that it uses. They'll then use conversion factors to find the difference between kilograms and pounds. Essential...
Pennsylvania Department of Education
Volume and Surface Area
Build boxes using unit cubes to compare surface area and volume. The group performs multiple experiments to determine properties of volume, such as if it makes a difference which order the dimensions are multiplied in. Extensive...
Curated OER
Food Ways - Graphing
Sixth graders choose the appropriate graph to display collected data. They interview each other on what foods they eat. They also interview elders and find out what types of food they grew up eating. They create graphs to display the...
Curated OER
Making Math Meaningful in March Madness
Middle schoolers examine the statistics of March Madness, the college basketball tournament. They watch videotaped basketball games to collect data for further analysis using Word and Excel. They analyze the data in a variety of...
Curated OER
Digital Images: From Satellites To The Internet
Learners examine digital images and how satellites orbiting Earth send information and pictures to Earth over the Internet. They use a digital camera to put pictures on a computer and decode a satellite image from space.
Curated OER
How to Make Histograms
Students collect data and plot it using a histogram. In this statistics lesson, students interpret histograms. They find the frequency, percents and density.
Curated OER
A Canadian Inventory: The Way We Are!
Students, in groups, explore major thematic sections of the Atlas of Canada. They use their findings to produce a wall display, consider and incorporate the issue of sustainability into their material and deliver a presentation to the...
Curated OER
That's the Way the Ball Bounces
Students investigate and compare the bouncing ability of the materials from which four different balls are made. They determine which material performs the best for use as a basketball. After collecting data in a small group they...
Curated OER
To Every Thing There Is A Season...
Students use the artwork by Robert Harris to examine the four seasons. In groups, they identify the clothing worn in the artwork and create a dance which resembles the painting. They also practice reading a thermometer and identify...
Curated OER
Biodiversity and Ecosystems
Middle schoolers differentiate between biotic and abiotic factors in this science lesson plan. Learners collect data for the experiment and analyze the data after graphing it using the CBL 2. This experiment is split into two different...
Curated OER
The Disappearing Kelp Forest
Learners observe the effect "El Nino" left on kelp plants and sea urchins. They analyze the data collected by researchers, by graphing it on a TI calculator. Before graphing and analyzing the data, you may want to revisit the events of...
Curated OER
Health of Aquatic Life a Real Problem
Learners explore the health of aquatic life in this science lesson They measure and track the oxygen level in the water to determine the health of the aquatic life. They collect this data using the TI explorer to graph and analyze their...
Curated OER
Curve Fitting
Pupils investigate linear, quadratic, and exponential regressions. They plot sets of data points, determine the regression equation that best fits the data and lastly investigate the coefficient of determination.
Curated OER
Charging Up, Charging Down
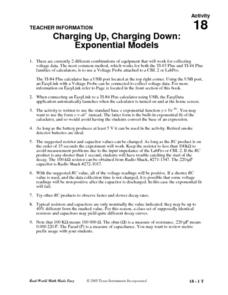
Learners collect and analyze voltage data. Then, they investigate exponential functions using the TI and a Voltage Probe and graph their data and analyze it using a table.
Curated OER
Tight Rope
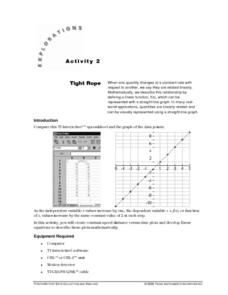
Learn how to explore the concept of linear functions. In this linear functions lesson, students collect linear data from a motion detector. Students walk to create a linear function. Students plot the points on a graph and determine a...
Curated OER
Energy Content of Foods
Learners collect data, organize and analyze the data and compare it to real life scenarios. This assignment requires two class periods.
Curated OER
Let the River Run
Pupils examine deposits found in a river in this science lesson plan. They collect data of sediment deposit found in the Mississippi river, then graph and analyze their data using the TI.
Curated OER
TI Workshop Presentation Guide for "Preparing for Proofs"
Pupils discover proofs using the TI in this geometry lesson. They collect data from newspaper and magazines and analyze their data using the TI, relating it to proofs.
Texas Instruments
Can You Breathe Like a Pinniped?
Young learners compare the breathing patterns of different animals in this pinniped lesson. They examine the breathing pattern of California sea lions and northern elephant seals. Pupils collect, compare and analyze data concerning...
Curated OER
FCAT Real World Solving Linear Equations/Systems
Pupils relate real life situation to the equations, graphs and inequalities. They model real life scenarios using matrices and draw conclusions from their data. This lesson plan is aligned with FCAT.
Curated OER
Chill Out: How Hot Objects Cool
Teach how to explore exponential equations. In this Algebra II lesson, learners investigate the graph that occurs as a hot liquid cools. Students model the data algebraically.


