Curated OER
Evaporation
First graders explore, analyze, document and study weather and the water cycle. They observe the weather and begin a weather journal. Each student interacts with the concepts of evaporation, condensation and precipitation, clouds,...
Alabama Learning Exchange
The Water Cycle
Learners identify the stages of the water cycle. They listen to the book "Magic School Bus: Wet All Over," examine the Build Your Own Water Cycle website, predict and measure the amount of water in a jar for a week, and read a short play...
Curated OER
Layers of the Atmosphere Foldable
Aspiring meteorologists make themselves a tool for reviewing the characteristics of each layer of the atmosphere. The procedure for this little project divides the paper into five sections, but many earth science teachers opt for the...
Curated OER
Surface Meteorological Observation System (SMOS)
Young scholars monitor local surface weather conditions for at least 30 days. They interpret the data by graphing it and detemining percentages.
K12 Reader
Meteorologists
Meteorologists and the tools they use are the subject of a reading comprehension worksheet that asks kids to read the attached article and respond to a series of comprehension questions.
Curated OER
Radiation Comparison Before and After 9-11
Using the NASA website, class members try to determine if changes could be detected in cloud cover, temperature, and/or radiation measurements due to the lack of contrails that resulted from the halt in air traffic after the attacks...
Curated OER
Third Grade Science
In this science activity, 3rd graders answer multiple choice questions about measurement, plants, water, fossils, and more. Students complete 25 questions.
Curated OER
Cold, Clouds, and Snowflakes
Young scholars explore satellite data and graphing. In this weather data analysis math and science lesson plan, students analyze NASA satellite data to draw conclusions about geographical areas where precipitation might have happened....
Curated OER
Weather Chart
Students select at least 6 cities from around the world to keep track of their high and low temperatures over a period of time.
Curated OER
Clouds
Pupils study how to use the Internet as a static information collection tool, to enhance the literature stories on the weather and study how to use the calculator.
Curated OER
Understanding Salinity
Middle schoolers discuss why the ocean is salty. They discuss what salinity is. Students are told that is they want to know how much salt is in a body or water, they would use a special scientific tool. They complete an Estuarine Layers...
Curated OER
Precipitation
Fourth graders identify the conditions that create rain. They read and discuss weather records, and write a news article that includes factual information fom one of the listed weather records.
Curated OER
Observing Fall Migrants
Students keep a detailed data collection log of the different types of monarch behavior. They track the weather conditions daily and link it to the migration of the monarchs. They summarize their data using either a graph or a computer...
Curated OER
What is Climate?
Students explore the differences between climate and weather. For this introductory lesson of a climate unit, students discuss the vocabulary and concepts associated with weather and climate. They build their information base for the...
Curated OER
Traditional Stories about Wind
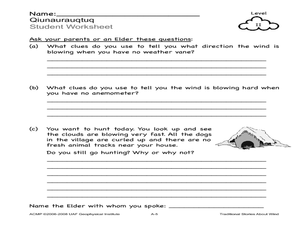
Students observe and talk about wind using no weather instruments. For this wind lesson plan, students use their senses to observe wind. They also interview an Elder about wind.
Curated OER
Surface Area and Measuring
Tenth graders explore volume and surface area through percentages. In this geometry lesson plan, 10th graders analyze the surface area of two and three dimensional shapes, then use percents and ratio to compare the two.
Curated OER
Weather Predictions
Fourth graders explore meteorologists. They explore symbols on a weather map and make five day forecasts.
Curated OER
How Can You Measure Weather?
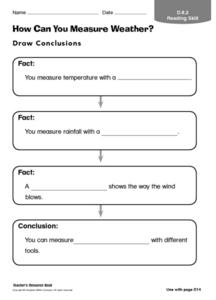
In this measuring weather worksheet, students fill in the blank of 4 statements about the different tools scientists use to measure weather. This worksheet is a graphic organizer.
Curated OER
Weather Whys- Cloud Watching Journal
Students examine how natural processes change the earth by identifying their local water cycle. Individual students complete a cloud journal over a specific period of time. They observe clouds daily and take photographs of the clouds...
Polar Trec
Where is the World's Water?
Scholars discover the amount of the Earth's water in various locations such as the ocean, ice, the atmosphere, etc. They then make a model of the how much water those percentages represent. Finally, analysis questions bring the concepts...
Polar Trec
Global Snow Cover Changes
Snow is actually translucent, reflecting light off its surface which creates its white appearance. Pairs or individuals access the given website and answer questions about snow cover. They analyze graphs and charts, examine data, and...
Chicago Botanic Garden
Historical Climate Cycles
Scientists use ice core samples to obtain temperatures of the earth from 400,000 years ago! The third of five lessons instructs pupils to interpret historical climate data to see changes over time. In part I, participants interpret...
Curated OER
Teaching the Tr'panier Trapezoid Kite
Young scholars analyze how the parts of a system go together and how these parts depend on each other. They comprehend the forces in terms of strength and direction. Students observe, measure and describe weather indicators.
Curated OER
Precipitation
Students write their own newspaper article about a weather story using newspapers and a weather records worksheet.


