Curated OER
Using My Nasa Data To Determine Volcanic Activity
Young scholars use NASA satellite data of optical depth as a tool to determine volcanic activity on Reunion Island during 2000-2001. They access the data and utilize Excel to create a graph that has optical depth as a function of time...
Curated OER
Hands-On Weather Data Collecting
Fifth graders study weather in their community, in the United States, and around the world. They use thermometers, the beaufort wind scale, and simple weather symbols to measure and record the weather outside their school. They also look...
Curated OER
Operation Weather Station
Young scholars work in cooperative groups to create a working weather station. Tkey use the weather station to collect weather data over a one-week period. Students compare the data from their weather station to actual weather...
NASA
Geographical Influences
"If global warming is real, why is it so cold?" Distinguishing the difference between weather and climate is important when it comes to understanding our planet. In these activities, young scientists look at the climate patterns in a...
Curated OER
Weather Predictions
Students record weather data and create a five day forecast. Students investigate the roles of meteorologists and identify symbols used on a weather map. After gathering weather data for a week, students will create a five day forecast...
Curated OER
Bringing Climate Change Into the Classroom
Students investigate the greenhouse effect and examine the potential effects of climate change in the Arctic. They construct a mini-greenhouse and test its effect on temperature, analyze historical climate statistics, and conduct an...
Curated OER
Weather Patterns
Fourth graders collect and chart weather data over the course of the school year either using tools at school or media resources. They agree on weather terms to use in their observations and write them on the assigned sheet. Finally,...
Curated OER
Weather
Students recognize that carbon dioxide's role in the greenhouse effect. They research the greenhouse effect to design and create a greenhouse structure to measure the changing temperatures over a 24-hour period. In addition, they write a...
Curated OER
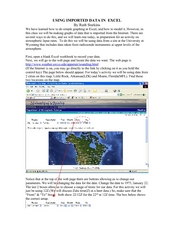
Using Imported Data in Excel
Students import atmospheric data from the internet. In this earth science activity, students graph the data they collected. They complete the worksheet after the activity.
Curated OER
Layers of the Atmosphere Foldable
Aspiring meteorologists make themselves a tool for reviewing the characteristics of each layer of the atmosphere. The procedure for this little project divides the paper into five sections, but many earth science teachers opt for the...
Center Science Education
Hurricanes and Climate
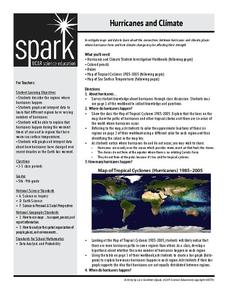
Feeling under the weather? This lesson plan on hurricanes can whip things up! With professionally designed maps and handouts, teach your future weathermen (or women) where, when, and how hurricanes occur. They identify hurricane regions...
Curated OER
Differences between Climate and Weather
Students collect weather data over weeks, graph temperature data and compare the temperature data collected with averaged climate data where they live.
Curated OER
Water Cycle, Weather, and Climate
Eighth graders investigate the water cycle and its processes. They examine temperature and precipiation data to classify climate of ten cities. They then create a climate map of the world.
Curated OER
Cloudy vs. Clear
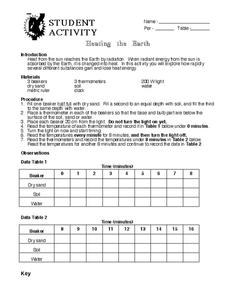
Students analyze line plots. For this weather lesson using real NASA data, students discuss how weather affects the way the Earth is heated by comparing different line plots.
Curated OER
Weather, Sea Level Rise and Climate Change
Eighth graders compare and contrast weather and climate. In this earth science lesson, 8th graders research weather data site and analyze historical data. They present their findings in class and explain identifiable trends.
Laboratory for Atmospheric and Space Physics
Polar Vortex Interactive
An interactive lesson places pupils as scientists who must learn why the ozone layer is being destroyed by analyzing the data from multiple satellites. The first analysis shows how UV is related to the ozone cycle. The second...
Curated OER
Climate Systems - Which Location Is Best For Me?
Students study the difference between weather and climate. In this climate systems lesson plan students search the Internet for the parts of the Earth's system, gather climate data and complete a challenge scenario.
Curated OER
Formation of Rain
Students sequence the steps leading to the formation of rain, and design a model to represent these steps. This task assesses students' abilities to classify, generalize, infer, interpret and communicate data, and construct a pictorial...
Curated OER
Formation of Wind
Students correctly sequence the steps leading to the formation of wind, and describe the cause and effect relationships involved in the formation of wind. This task assesses students' abilities to classify, generalize, infer, interpret...
Curated OER
Heating The Atmosphere
In this science worksheet, high schoolers look for the answers to finding the correct temperatures that match the location in the atmosphere.
Curated OER
Weather temperatures
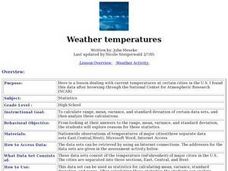
Students investigate the given statistics about temperatures in cities around the nation in order to look for a pattern. They measure the mean, median, and mode for the data set of temperatures.
Curated OER
Activities to Enhance STEDII Data
Students develop an understanding of related weather processes such as wind, cloud cover, and temperature using STEDII data and instrumentation. In addition, they integrate mathematical calculations to produce a forecast map.
Curated OER
Weather Patterns
Students collect weather data over a thirty day period to gain an increased understanding of the weather patterns in their area. Once the data is collected, students post their finding online using a web tool. Finally, students attempt...
Curated OER
Weathering Rates
Students calculate weathering rates from tombstone weathering data. Atmospheric (and precipitation) chemistry determines the rate of weathering for marble tombstones. They are shown data from a rural and an unrban cemetery, and are...


