Curated OER
Weather and Atmosphere
Seventh graders explain the layers of the atmosphere. They identify the causes of air pollution. They analyze real world weather data. They explore and describe clouds. They develop models to explain atmosphere and weather.
Curated OER
Weather Tools
Pupils explore Earth science by participating in a weather identification activity. In this scientific instrument lesson, students identify several weather related tools such as the weather vane, thermometer and rain gauge. Pupils...
Curated OER
When Disaster Strikes! Rocks, Minerals, Erosion and Weather
Students pretend the area they live in is subject to wind, waves and rain. In groups, they pretend they are a groups of meteorologists or geologists and are to report on the weather and damage that could occur there. Each group develops...
American Museum of Natural History
What do you Know About Climate Change?
Test the class's knowledge of the key components of climate change. A 10-question online quiz asks learners about weather, climate, greenhouse gases, and several other concepts related to climate change. Interactive and easy for...
American Chemical Society
Climate Change and the Keeling Curve
Global warming has long been in the making. A thorough review of decades of research helps pupils discover the weather patterns of global warming. Learners then connect the weather changes to data in the Keeling Curve that reveals trends...
Curated OER
Seasons and Cloud Cover, Are They Related?
Students use NASA satellite data to see cloud cover over Africa. In this seasons lesson plan students access data and import it into Excel.
Curated OER
Measuring the Number Of Calories In Sunlight
Students., in groups, define calorie and compare the absorption of solar energy by three different collectors. They define solar constant and offer several explanations for discrepancies between the data collected and the solar constant.
Curated OER
How Mountains Shape Climate
Pupils use raw data to make a climatograph; they explain the process of orographic precipitation and the concept of a rain shadow.
Curated OER
Meteorological Predictions
Students make a link between prediction and hypothesis in math and science. Based on data collected over one week, students evaluate the predictions of local weather forecasters, compare the predicted outcomes to the actual weather...
Curated OER
Forecasting Weather
In this weather activity, students conduct an experiment where they record the weather observations for a week. Then they determine the air pressure using an aneroid barometer and estimate the amount of sky covered by clouds. Students...
Curated OER
Local Weather And Location
Young scholars explain how uneven heating of Earth affects wind and water currents. They describe the limits on current technology in predicting weather and how the Water Cycle is related to local weather.
Curated OER
Weather, Sea Level Rise and Climate Change Course
Students explain the impact of glacial melting to global climate change. In this environmental science lesson, students design an experiment to investigate the effect of salinity change to melting glaciers. They share their results to...
Curated OER
Dimming the Sun
Learners collect, interpret and analyze weather variable data. They describe atmospheric variables that affect evaporation. Students create graphs and analyze the information collected.
Curated OER
Meterology -- Atmosphere
Fourth graders discover how weather predictions are made. They list the responsibilities of a meteorologist. They identify weather instruments and state their functions.
Curated OER
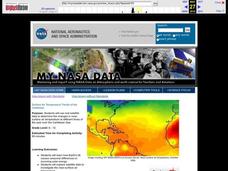
Surface Air Temperature Trends of the Caribbean
Students investigate the seasonal changes to sea surface and near-surface air temperatures near the equator. They use actual satellite data to track and graph the differences in air and sea temperatures during different seasons in the...
Curated OER
The Effect of Rain on Morning Temperatures
Eighth graders study the effects of the water cycle. They create a graph of the air temperature versus solar radiation on a rainy and clear 24 hour period using data from a provided link. Afterward, they answer questions to determine the...
Chicago Botanic Garden
Climate Change Around the World
Look at climate change around the world using graphical representations and a hands-on learning simulation specified to particular cities around the world. Using an interactive website, young scientists follow the provided...
NASA
Down to Earth
There are only 10 types of people in the world: those who understand binary and those who don't. The lesson includes four activities in which students learn binary, convert binary to images, understand CCD arrays, and interpret...
Curated OER
Circle the Earth - Explore Surface Types on a Journey around Earth
Students use CERES percent coverage surface data with a world map in locating landmasses and bodies of water at Earth's Equator.
Curated OER
Surface Meteorological Observation System (SMOS)
Young scholars monitor local surface weather conditions for at least 30 days. They interpret the data by graphing it and detemining percentages.
Curated OER
Does Cloud Type Affect Rainfall?
Student uses MY NASA DATA to obtain precipitation and cloud type data. They create graphs of data within MY NASA DATA. They compare different cloud types as well as precipitation types. They describe graphs of the precipitation and cloud...
Curated OER
Seasonal Cloud Cover Variations
Learners, in groups, access data from the NASA website Live Access Server regarding seasonal cloud coverage and the type of clouds that make up the coverage. They graph the data and make correlations between types, seasons and percentages.
Curated OER
Global Warming Statistics
Students research real-time and historic temperature data of U.S. and world locations, and analyze the data using mean, median, and mode averages. They graph the data and draw conclusions by analyzing the data. A spreadsheet is used to...
Curated OER
Meteorology
Fourth graders study how atmospheric conditions change while naming the things that make the weather change. They investigate the affects of air masses, weather fronts and high/low pressure by looking at weather maps from newspapers.


