Curated OER
Measuring Water Vapor: The Microwave Water Radiometer (MWR)
Pupils investigate water vapor. They view and analyze photos, conduct Internet research, and analyze the total water vapor/total liquid water data plot.
Curated OER
Meteorologist for a Day
Students research weather patterns, predict the weather for a US city and write a weather forecast that be presented to the class. The forecast should explain their weather prediction and the weather patterns and conditions it is based on.
Curated OER
Weather Chart
Learners select at least 6 cities from around the world to keep track of their high and low temperatures over a period of time.
Curated OER
Meteorology
Seventh graders examine the job of meteorologists. They decide which characteristics of the atmosphere that meteorologists focus on. They use local weather maps from newspapers to predict weather in their area.
Curated OER
The Science of Weather: Humidity makes air feel even hotter.
Students examine the effects of heat and humidity. In this weather instructional activity, students read a chart to determine the effects heat and humidity can have on the human body. This instructional activity includes an optional...
Curated OER
Cloud Observations using GLOBE Protocols
Pupils observe which of ten types of clouds are visible and how much of the sky is cloud covered. They see that by observing clouds, we can get information about temperature, moisture, and wind conditions in different places in the...
Curated OER
Measuring Precipitation
A little engineering design is mixed into this lesson on precipitation measurement. Groups plan and construct a rain gauge, and use it to collect precipitation. As part of the PowerPoint presentation, learners view a satellite map of...
Curated OER
Graphing Data - Temperature
Seventh graders measure and record temperature over a given time period. They compare the recorded temperatures to the 40-year recorded normal average temperatures for the same area. Students display and interpret their findings in a graph.
Curated OER
High Mountain Retreat
Students explore and analyze atmospheric conditions for a high mountain retreat. They examine the relationship between altitude, atmospheric pressure, temperature and humidity at a particular location. In addition, they write reports...
Curated OER
Physical Characteristics of the Troposphere
Students lexplore environmental trends in the troposphere- temperature, dew point, pressure and wind speed- by checking their hypotheses against data collected by weather balloons.
Curated OER
Physical Characteristics of the Troposphere
Students examine troposphere graphs and mcompare their hypotheses with data collected by weather balloons launched from the NOAA ship, Ronald H. Brown. they write summaries about the physical properties of the troposphere.
Curated OER
CO Buildup City
Students conduct a controlled experiment. They collect data in an organized manner. Students analyze data to reach a conclusion and communicate findings. They explain how city size, temperature, and pollution is related to the air quality.
Curated OER
Will There Be Ozone Tomorrow
Young scholars collect and analyze real time data. They make comparisons and determinations about the status of ozone in their local area and predict the Ozone level for the next day
Curated OER
A Comparison of Land and Water Temperature
Students use the NASA website's Live Access Server to create a graph of surface temperature at two locations on earth. They analyze the data and then answer specific questions provided in this lesson. They also examine and compare the...
Ohio Department of Education
Observe Then Infer
Upper elementary scientists learn that observations made can lead to inferences. They rotate through six weather-related stations that challenge them to make observations and then draw inferences from their observations. A...
Curated OER
Conditions at Sea
Young scholars examine wave formation. In this wave lesson, students discover how waves are formed and how the weather at sea is predicted. Young scholars study ocean vocabulary and understand the Beaufort Wind Force Scale.
Curated OER
Watch the Sky
Learners describe the atmosphere, weather conditions, and climates. They describe seasonal changes in weather, the composition and characteristics of the atmosphere. Students describe patterns of changing weather and how they are...
Curated OER
Environment: Climate Change
Students explore climate change and the greenhouse effect. Using provided definitions, they assess local weather conditions and analyze long term climatic data for their areas. Once they explore the concept of and connection between...
Curated OER
Radiation Comparison Before and After 9-11
Using the NASA website, class members try to determine if changes could be detected in cloud cover, temperature, and/or radiation measurements due to the lack of contrails that resulted from the halt in air traffic after the attacks...
Curated OER
Is Global Warming Affecting Hurricanes?
In this hurricane worksheet, students use data charts showing the number of hurricanes and the severity of these hurricanes to determine if global warming is causing an increase in hurricanes. This worksheet has 2 short answer questions.
Curated OER
Hectic Hurricanes!
Students determine what they know about hurricane formation. They experiment to explain hurricane formation and track a hurricane that forms in the Caribbean Islands.
Curated OER
A Comparison of Land and Water Temperature
Students examine NASA satellite observations of surface temperature and investigate the seasonal changes of land and water temperature.
Curated OER
Troical Atlantic Aerosols
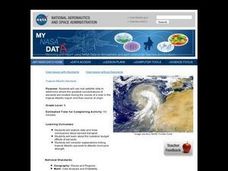
Students explore the effect aerosols have upon he weather and climate. They observe NASA satellite images to explore and draw conclusions about aerosol transport. From studying the images, students track the path of aerosols. They...
Curated OER
Rain Shadows and Sea Breezes
Students plot the average rainfall for a variety of cities in the United States. Using the map, they work together to determine patterns on which toxicants are transported through the air. They determine the impacts of various weather...


