Wind Wise Education
What Causes Wind?
Through watching several classic air pressure demonstrations, middle schoolers determine that high pressure areas move toward lower pressure areas, heated air causes a drop in pressure, and forces exist when pressures are unequal....
Curated OER
Kaboom!
Students identify the three ingredients of weather.. They create weather vanes, thermometers, and rain gauges.
Curated OER
Probability With a Random Drawing
Students define probability, and predict, record, and discuss outcomes from a random drawing, then identify most likely and least likely outcomes. They conduct a random drawing, record the data on a data chart, analyze the data, and...
Curated OER
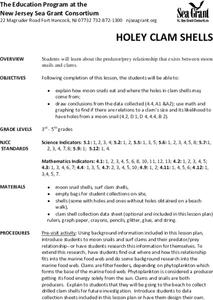
Holey Clamshells
Pupils analyze data to make hypotheses and conclusions regarding the predator/prey relationship between moon snail and surf clams.
Curated OER
CSI Clamshell Investigation
Pupils explore and explain how moon snails eat and where the holes in clamshells come from and then draw conclusion from the data collected. They incorporate math and graphing skills to determine if there is a relationship to a clam's...
Curated OER
Contrails and the Climate
In this contrails and climate worksheet, students read a short article about the effects of contrails on the weather and the climate. They answer 5 questions about the article.
Curated OER
Mystery Paint
Students use the scientific method to determine the properties of various kinds of paints, use collected data to identify paint samples that are not properly labeled and use proper science safety techniques while working with chemical...
Curated OER
Using Newsprint as a UV Detector
Students investigate the effects of UV radiation. In this earth science lesson, students explain how the time of day relate to UV abundance on Earth. They determine if weather affects the amount of UV that Earth receives.
Curated OER
Weather for Health
Ninth graders encounter various types of numerical information (represented in multiple ways), much of which is abstract and difficult to comprehend. In this instructional activity, 9th graders will convert given information into bar...
Curated OER
Wind Energy
Students explore wind energy by making a pinwheel to model a wind turbine. They experiment with their turbine by placing it in different locations for optimal energy.
Curated OER
Tsunami Simulation Experiment
Students examine the importance of tsunami warning systems. They read and discuss an article, conduct an experiment in a wave tank, calculate wave velocities of tsunamis, and identify what happens to tsunamis as they approach a shoreline.
Curated OER
TE Lesson: Tsunami Attack!
Students examine how earthquakes, volcanoes, and landslides can trigger tsunami waves. They determine how engineers use sensors to detect the dangerous wave, and how they help design building that will survive the wave force and water.
Curated OER
Database
Second graders collect daily weather information and introduce them to databases.
Curated OER
Climate Patterns across the United States
Students articulate differences between climate and weather using examples in a written statement. Using climate data from across the country, they describe climate patterns for various parts of the United States on a map. Students...
Curated OER
Trouble in the Troposphere
Students create graphs using NASA data, compare ozone levels of several U.S. cities, analyze and evaluate the data and predict trends based on the data, and discuss and describe how human activities have modified Earth's air quality.
Curated OER
Creeping
Students observe, measure, and graph a model of slow down slope movement representing soil creep. This task assesses students' abilities to collect, record, and organize data, set up graph axes, plot data points, draw line graphs, apply...
Curated OER
Keep It Cool
Students complete a science experiment to study insulation, heat transfer, and permafrost. In this permafrost study lesson, students design and test a soda insulator. Students graph their class data and discuss the results. Students...
Curated OER
Namib From Space
Students view photos of the Namib Desert from space as they appear on the World Wide Web. They study the photos and identify landmarks from space as they examine how to collect information from the Internet for a class presentation.
Curated OER
Watching the Clock: An activity to build media-savvy students
Learners analyze time constraints on broadcast news. They apply data collecting and data display skills. They identify the difference between news progams and the evening news.
Curated OER
Scientific Graphs
Students organize data collected from their experiments using graphs. In this statistics and biology lesson, students organize their scientific data from an article into readable graphs. They define the usefulness of their graph and...
Curated OER
Trouble in the Troposphere
Pupils Use data sets from MY NASA DATA to produce graphs comparing monthly and yearly ozone averages of several U.S. cities. They analyze and evaluate the data and predict trends based on the data. In addition, they discuss and describe...
Curated OER
Believe It...Or Not
Students critically analyze data regarding climate changes using a glossary of terms generated by examination of climate related articles. They examine and graph climatic data, and discuss, hypothesize and test apparent discrepancies in...
Curated OER
Frogs: Fact or Folklore
Young scholars discover how frogs are adapted to their environment. They view and discuss a Discovery Channel video on frogs and the myths surrounding frogs. In small, groups they compile data on frogs from the internet to create a...
Curated OER
Which reference book helps most?
Fourth graders utilize various reference materials to find specific types of information. In this library research lesson, 4th graders choose the best source of information from the library's reference collection to answer questions.


