Curated OER
Time and Cycles - Dendrochronology
Middle schoolers investigate the lives of trees by examining ring cycles. In this plant life instructional activity, students identify the field of study known as dendrochronology and discover its history. Middle schoolers...
Curated OER
Using Soil properties and Vegetation Differences to Hypothesize the Land Use History and Topographic Differences between Two Locations
Ninth graders take soil samples and perform tests on these samples.
Curated OER
Create Your Own Investigation
Students design and implement an experiment intended to measure and analyze the air quality of a particular location. They focus on looking for ozone and particulate pollutants.
Curated OER
How Much Is There To Eat?
Tenth graders compare the relationship of food production and population in India with the southern regions of the United States.
Curated OER
Biodiversity in Our Watershed
Eighth graders create a database of animals and birds in the area in which they live. They use molded prints to make a cast of an imprint from a specific animal. They identify and research animals and prepare an outline for an oral...
Curated OER
State Your Position
Learners practice using a global positioning system. They discuss the use of celestial objects as navigation points and its problems. They list the advantages and disadvantages of GPS as well.
Curated OER
Twister Redux
Pupils pick up science knowledge as they track and examine natural disasters. They keep a daily journal of results and reflections. Students get to follow a real tornado chaser and learn thunderstorm formation. They incorporate how...
Curated OER
Life in a Cup
Third graders make and maintain a mini terrarium. They keep a daily journal of what happens in their terrarium and record daily observations and measurements.
Curated OER
Introduction to the Barnegat Bay Estuary
Young scholars research estuaries. For this estuaries lesson, students discuss the differences in a bay and an ocean. Young scholars watch a PowerPoint of the properties of the estuaries and geography of Barnegat Bay. Students complete a...
Curated OER
Com-Post With Us?
Students discuss the importance of reducing, recycling and reusing materials to help the environment. As a class, they create a worm bin and observe how it turns material in to compost. They use the internet to research the...
Curated OER
Comparative Stream Quality
Students examine water quality on a nearby stream. They collect water samples and test for various factors, including any contamination from the treatment plant, and present their information in a Powerpoint presentation.
Center for Innovation in Engineering and Science Education, Stevens Institute of Technology
Ciese Real Time Data Projects:collecting Weather Data and Keeping a Weather Log
Over a period of two weeks students will use their class-made instruments to measure and record weather data. Students will also compare their data to online weather data. The final activity involves analyzing the collected data to look...
Center for Innovation in Engineering and Science Education, Stevens Institute of Technology
Ciese Real Time Data Projects: Weather Scope: A Study of Weather and Climate
Use real-time data to study factors that affect weather and climate, create weather instruments, and share data with learners around the world.
Center for Innovation in Engineering and Science Education, Stevens Institute of Technology
Ciese Real Time Data Projects: Building and Using Weather Instruments
In this lesson plan students will build and learn how to use three weather. They will use these instruments to collect weather data over a period of two weeks.
Center for Innovation in Engineering and Science Education, Stevens Institute of Technology
Ciese Real Time Data Projects: The Stowaway Adventure
Through this series of Internet-based learning experiences and activities, students will use real-time data to track a real ship at sea and monitor weather conditions. Includes a teacher's guide with problem-solving lesson plans...
Center for Innovation in Engineering and Science Education, Stevens Institute of Technology
Ciese Real Time Data Projects: Weather in Our Own Backyard
This lesson is divided up into three activities, two of which take place outside. By the end of the lesson students will be able to describe weather conditions on a given day and some of the factors that contribute to them. Students will...
Center for Innovation in Engineering and Science Education, Stevens Institute of Technology
Ciese: Weather Scope: An Investigative Study of Weather and Climate
The activities in this comprehensive weather unit are designed for Grade 6 and up. Learners will use real time data from around the world to conduct an investigation about weather and climate.
University Corporation for Atmospheric Research
Ucar: Project Sky Math
Teachers will be interested to explore the SkyMath module, and the 16 classroom activities at this site. In this program, students will collect and record real-time weather data to analyze. Data analysis, graphing, number relationship,...
Science Buddies
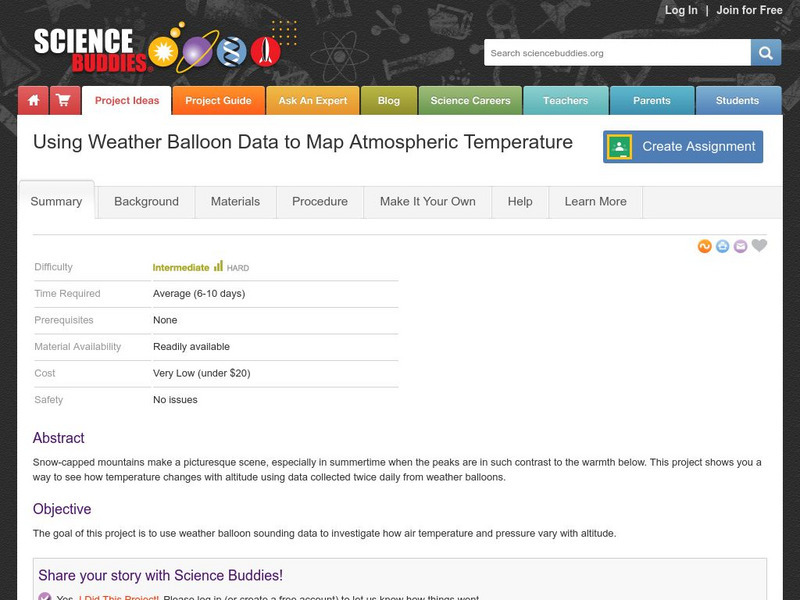
Science Buddies: Using Weather Balloon Data to Map Atmospheric Temperature
Snow-capped mountains make a picturesque scene, especially in summertime when the peaks are in such contrast to the warmth below. This project shows you a way to see how temperature changes with altitude using data collected twice daily...
Center for Innovation in Engineering and Science Education, Stevens Institute of Technology
Ciese: Wonderful World of Weather Project
If you're studying the weather, this is an excellent project for students to develop their understanding of how weather is measured. They will use real time data from their location as well as from around the world to learn about weather...
NOAA
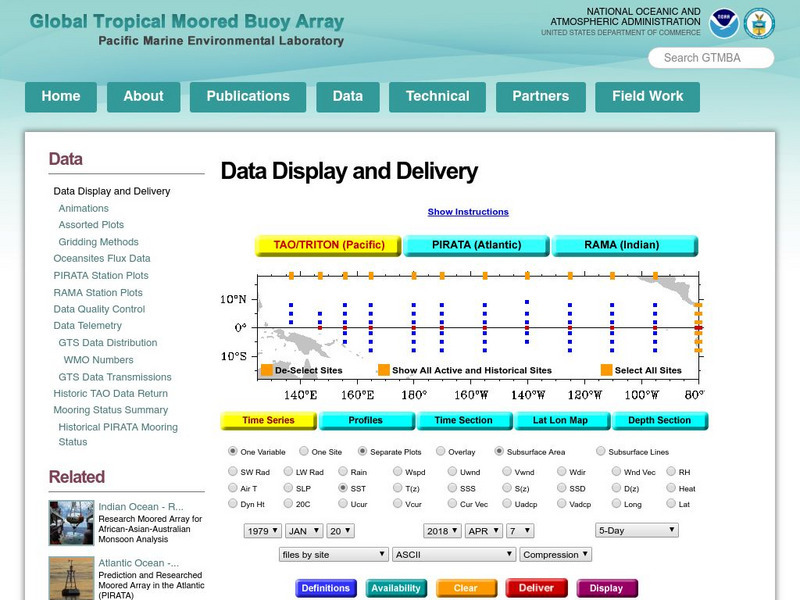
Noaa: Pmel: Tropical Atmosphere Ocean Project: Tao/triton Data Display
Resource features real-time data from moored ocean buoys for improved detection, understanding, and prediction of El Nino and La Nina with diagrams.
Center for Innovation in Engineering and Science Education, Stevens Institute of Technology
Ciese Navigational Vectors
For this project, students use real time data to learn how pilots navigate when they fly. Students go through a series of lessons on vectors, weather maps and flight tracking, then take a pilot's test where they apply what they have...
Center for Innovation in Engineering and Science Education, Stevens Institute of Technology
Ciese: Collaborative Projects
Using a variety of science topics, these projects link your class with classes around the world in data collection and analysis. There are projects recommended for all grade levels. Begin dates and end dates are listed to help in...
Center for Innovation in Engineering and Science Education, Stevens Institute of Technology
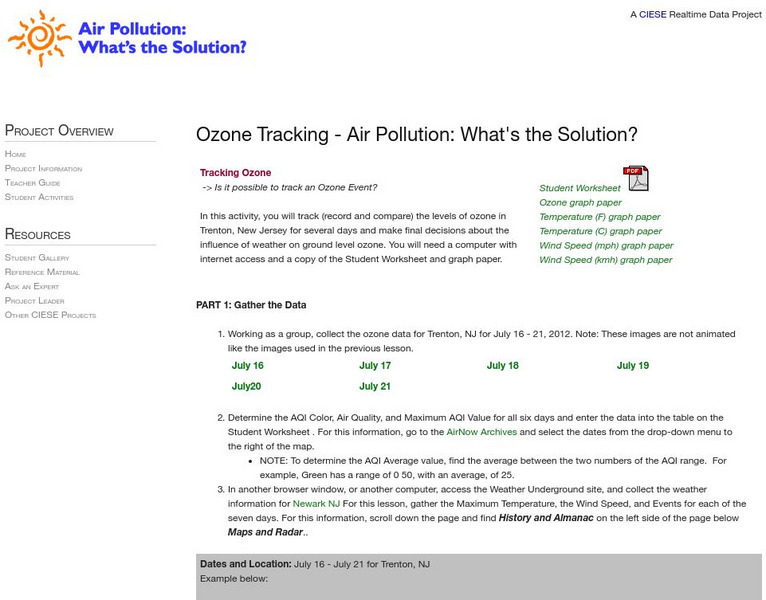
Ciese Real Time Data Projects: Air Pollution: Tracking Ozone
In this activity, you will monitor the levels of ozone in Trenton, New Jersey for several days and make final decisions about the influence of weather on ground level ozone.


