Curated OER
Do Fast CMEs Produce Intense SPEs?
In this coronal mass ejections and Solar Proton Events worksheet, students create a Venn Diagram to represent given data. They answer 5 questions about the data related to the number of coronal mass ejections and Solar Proton Events...
Curated OER
Oceanic Heat Budget Activities
Young scholars map and research imaginary islands located in different parts of the world. They describe the weather and climate of their island and show how local currents, water temperatures and waves may influence the weather patterns.
Curated OER
Fall Around the World
What is autumn like in Shanghai? How much rain falls during September in Sydney? Is Moscow cold in October? Take a virtual trip around the world with a research assignment on autumn in different countries. After learners answer questions...
Curated OER
Clear Day, Cloudy Day; Weather, Cloud Types and Formations
Students explore the formation of clouds and different cloud types. Students simulate a cloud formation within a bottle.
National Wildlife Federation
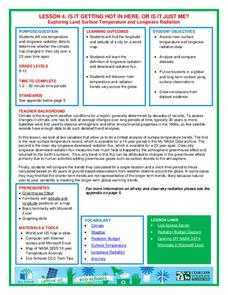
Is It Getting Hot in Here, or Is It Just Me?
Currently, only 2.1% of global warming is felt on continents, while over 93% is felt in the oceans. The fourth lesson in the series of 21 on global warming is composed of three activities that build off one another. In the first...
National Wildlife Federation
Citizen Science to the Rescue!
You don't have to be a scientist or even out of high school to contribute to scientific research. In the 12th lesson in the series of 21, scholars use this opportunity to add to the growing body of scientific knowledge and consider the...
NASA
Earth's Global Energy Budget
Introduce your earth science enthusiasts to the earth's energy budget. Teach them using an informative set of slides that include illuminating lecturer's notes, relevant vocabulary, embedded animations, colorful satellite maps, and a...
National Wildlife Federation
Wherefore Art Thou, Albedo?
In the sixth instructional activity in a series of 21, scholars use NASA data to graph and interpret albedo seasonally and over the course of multiple years. This allows learners to compare albedo trends to changes in sea ice with...
National Wildlife Federation
I Speak for the Polar Bears!
Climate change and weather extremes impact every species, but this lesson focuses on how these changes effect polar bears. After learning about the animal, scholars create maps of snow-ice coverage and examine the yearly variability and...
Laboratory for Atmospheric and Space Physics
Polar Vortex Interactive
An interactive lesson places pupils as scientists who must learn why the ozone layer is being destroyed by analyzing the data from multiple satellites. The first analysis shows how UV is related to the ozone cycle. The second...
Curated OER
Your Own El Nino
Young scholars conduct an experiment. In this El Nino lesson, students learn where El Nino storms come from, what they consist of and what effects they have. Young scholars also complete an experiment where they create a...
Curated OER
Thunderstorm Outflow I
Students study the characteristics of thunderstorms. They view an animation of radar reflectivity that depicts a thunderstorm and its outflow to locate the thunderstorm's outflow. Afterward, they explain what physical process occurs in a...
Curated OER
Scientist Tracking Network
Students correlate surface radiation with mean surface temperature of several geographic regions. They observe how these parameters change with latitude and construct an understanding of the relationship of solar radiation to seasonal...
Curated OER
Creating Climographs
Students use satellite data to compare precipitation and surface temperatures on different islands. In this satellite lesson students create graphs and explain the differences between weather and climate.
Curated OER
Analyzing Tree Rings to Determine Climate Change
Middle schoolers examine how to locate and access data sets. For this climate change lesson students import data into Excel and graph it.
Curated OER
A Comparison of Cloud Coverage over Africa
Students identify different climate regions and local weather patterns. In this cloud coverage instructional activity students use NASA satellite data and import it into Excel.
US Environmental Protection Agency
Tree Rings: Living Records of Climate
Open with a discussion on weather and climate and then explain how tree rings can provide scientists with information about the earth's past climate. Pupils analyze graphics of simulated tree rings from various US locations for the...
NASA
Freshwater Availability Classroom Activity
This science assignment produced by NASA teaches inquiring minds the distribution of Earth's water. Learners will appreciate and understand the importance of fresh water and how weather and climate affects everything.
Curated OER
NIGHT AND DAY: DAILY CYCLES IN SOLAR RADIATION
Students examine how Earth's rotation causes daily cycles in solar energy using a microset of satellite data to investigate the Earth's daily radiation budget and locating map locations using latitude and longitude coordinates.
University of Texas
Observing the Moon
Why does it look like there is a man on the moon? Why does the moon look different every night? These are the focus questions of a lesson that prompts class members to observe and record the nightly changes of Earth's natural...
Curated OER
Explore: 4th Grade Beaufort Wind Speed
Fourth graders measure wind speed, air pressure, humidity, temperature, and wind direction. They compare their observations with those of actual weather forecasts.
Curated OER
Search for Ice and Snow
Young scholars use satellite images to locate areas of ice and snow on the globe. They create a table showing the information they gathered. They present their information to the class.
Curated OER
Surface Air Temperature Trends of the Caribbean
Students investigate the seasonal changes to sea surface and near-surface air temperatures near the equator. They use actual satellite data to track and graph the differences in air and sea temperatures during different seasons in the...
Curated OER
Tropical Atlantic Aerosols
Students analyze NASA data from the Multi-angle Imaging Spectroradiometer. In this NASA data lesson plan, students access an assigned website to examine information from the MISR on the Terra Satellite. They determine how desert dust...


