Teach Engineering
Dress for Success
Dressing for success is not always about looking sharp. Sometimes it is about staying warm and dry. Present your class with an activity that challenges groups of pupils to design a layered material for blizzard conditions. The teams test...
Curated OER
How Much is There to Eat?
Students examine food production related to population density. In this interdisciplinary instructional activity, students gather data regarding food production in the American South and in India. Students follow the outlined steps to...
Curated OER
Web Adventure -- Oakland to Chicago Flight
Students develop an awareness of mathematics in a diverse number of careers, then describe three duties of a pilot that require mathematical skills. They increase understanding of interpreting data relationships presented in table format.
Rainforest Alliance
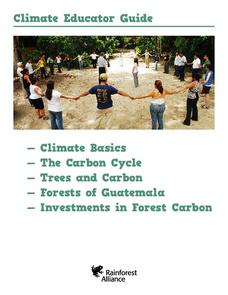
Climate Educator Guide
Climate change is a hot topic in the news. Class members examine carbon dioxide data to analyze trends of our atmospheric makeup over time. They also discuss climate and climate change, and determine how these changes are affecting life...
Discovery Education
Sonar & Echolocation
A well-designed, comprehensive, and attractive slide show supports direct instruction on how sonar and echolocation work. Contained within the slides are links to interactive websites and instructions for using apps on a mobile device to...
Curated OER
Understanding Cloud Formation
Students read and relate the poem, "Clouds" by Aileen Fisher to a demonstration on cloud formation. They create clouds in jars using ice water and matches then discuss the ways clouds can be used to predict weather.
Curated OER
Seasoning the School Year
Students observe the changes a class tree goes through as the seasons change and record observations in journals. They investigate changes in the weather, changes in the length of the day, and how that affects people. They create...
Curated OER
Environment: Wild Wind Direction
Students examine the different types of wind patterns. Using common materials, they construct weather vanes to measure and record wind direction over a two-week period. After analyzing the data, they draw conclusions about the...
Curated OER
It's Really Heating Up in Here!
Students create and observe a greenhouse effect model and discuss the implications of global warming theory for engineers, themselves and the Earth. They discover that Global warming is becoming an increasing concern as we learn more...
Curated OER
Engineering For The 3 Little Pigs
Young scholars engage in a activity which demonstrates the importance of rocks, soils and minerals in engineering and how using the right material for the right job is important. The students build three different sand castles and test...
Curated OER
And Now, the Weather...
Students collect and analyze data. In this middle school mathematics/science lesson, students collect temperature reading over a 24 hour period. Students analyze the data for mean, median, maximum and minimum.
Skyscraper Museum
Building a Skyscraper
Creating buildings that reach hundreds of feet into the sky is no easy task. The third instructional activity in this series begins with four activities that engage young architects in exploring the major challenges that are faced when...
NASA
Down to Earth
There are only 10 types of people in the world: those who understand binary and those who don't. The lesson includes four activities in which students learn binary, convert binary to images, understand CCD arrays, and interpret...
Curated OER
The Smallest Metric Measurements
In this metric measurement worksheet, students solve 15 problems in which three metric measurements in a series are analyzed. Students circle the smallest metric measurement in each problem.
Curated OER
An Introduction to Elementary Statistics
Students explain and appreciate the use of statistics in everyday life. They define basic terms used in statistics and compute simple measures of central tendency.
Curated OER
Dripping Wet or Dry as a Bone?
Students use a sponge and water model to explore the concept of relative humidity and create a percent scale. They define humidity and saturation, build a simple humidity/saturation model, collect, predict and interpret data, and create...
Curated OER
Range, Mean, Median, and Mode
Eighth graders find the range, median, mean, and mode of a data set. In this finding the range, median, mean, and mode of a data set instructional activity, 8th graders collect data about the high and low temperature for 10...
Curated OER
Book Excerpt from "The 23rd Cycle"
In this solar storms worksheet, students read an excerpt from the book "The 23rd Cycle: Learning to Live with a Stormy Star". Students answer 7 questions about the effects of solar storms on radiation exposure, health risk of airline...
Curated OER
Wind Energy
Students explore wind energy by making a pinwheel to model a wind turbine. They experiment with their turbine by placing it in different locations for optimal energy.
Curated OER
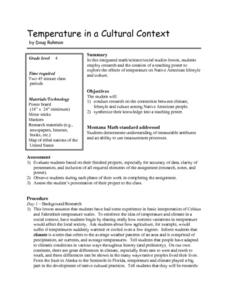
Temperature in a Cultural Context
Fourth graders investigate the effects of temperature on Native American lifestyle and culture. In small groups they conduct research on cultural practices showing a connection to the climate and create a poster displaying their...
Curated OER
How Probable is It?
Students explore probability. In this probability lesson, students look at videos and websites where they discover probability facts that can be used in situations. They determine the probability of different events.
Curated OER
Temperature High and Lows
Students gather high and low temperature readings through email. For this temperature graphing lesson, students use a spreadsheet to input data for a graph. students interpret the graphs to compare and contrast the data from different...
Curated OER
State Facts A Right Angle Puzzle
In this geometry worksheet, learners create words making a right angles each time. There are 50 questions to be solved with an answer key.
Curated OER
Scatter Plots
Seventh graders investigate how to make and set up a scatter plot. In this statistics instructional activity, 7th graders collect data and plot it. They analyze their data and discuss their results.


