Curated OER
Talking About the Present: "It is" (Weather)
In this present tense worksheet, students examine 5 pictures of weather and read the sentences about each picture. Students cross out the word that is incorrect in each set of parentheses.
Curated OER
Rocks and Minerals
Students are able to describe earth processes (e.g., rusting, weathering, erosion) that have affected selected physical features in students, neighborhoods. They are able to identify various earth structures (e.g., mountains, faults,...
Curated OER
Student Meteorologists
Students complete a unit about weather and meteorology. They read the book "The Big Storm," use weather equipment, view local weather reports, and create a weather forecast that is videotaped and presented to a younger class.
Curated OER
Water Cycle
Second graders investigate the water cycle. In this water cycle lesson, 2nd graders discover how the water cycle effects erosion and weathering. Students create their own terrariums to view the water cycle. Students illustrate their...
Curated OER
Project Helping Hands
Middle schoolers work as a team to help improve the quality of life in rural Africa and develop a plan how to spend grant money the United Nations has provided them with.
Curated OER
Weather Prediction 2
In this weather worksheet, students are given a weather map of the United States and they answer four questions. They predict the weather in two cities based on the map.
Curated OER
Science of Weather
Fifth graders conduct investigations and use appropriate technology to build an understanding of weather and climate. The activity is part of a layered curriculum unit that has the intention of differentiation for students.
Teach Engineering
Air Under Pressure
Introduce your class to air masses and how they affect the weather with a activity that focuses on the differences between high and low air pressure systems. The class explores actual weather data using archived weather data.
Teach Engineering
Building a Barometer
Forget your local meteorologist — build your own barometer and keep track of the weather with an activity that provides directions to build a barometer out of a narrow necked bottle, a glass, and some water. Using their barometer, teams...
National Park Service
Caves, Canyons, Cactus, and Critters
Mother Nature's Gravel Company is open for business! The unit includes four lessons covering weathering and erosion. Experiments are simple to complete and young geologists compare notes to see who makes the biggest ice wedge, moves...
Science Friday
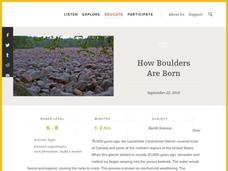
How Boulders Are Born
Want your class to rock? Then try this boulder activity. Pupils learn about a specific boulder field and use edible materials to demonstrate the geological processes that formed this unique feature. Weathering, erosion, and mass wasting...
NOAA
Your Own El Nino
Scholars make a model to discover how the force of trade winds over the Pacific Ocean creates an El Niño. Super scientists observe how the severe weather affects life in water and on land.
Curated OER
Understanding Climate Change
The young scientists in your class will appreciate a resource about different elements of climate change. The packet includes factual materials, informational text, and clear visuals, perfect for sharing with your environmental science...
Kenan Fellows
Detecting Rise in Body Temperature in Human and Animals and its Effects on Health
Beat the heat using sensors. Scholars research normal body temperatures for humans and a specific animal. In groups, they create sensors that monitor body temperature, as well as the weather. The goal is to reduce the occurrence of heat...
British Council
Unit 5: Making Arrangements
Are future entrepreneurs prepared to set up a meeting or schedule a conference call? Lesson five of a nine-part series of career education and skills activities focuses on proper punctuation and great grammar in the business world....
Columbus City Schools
Sedimentary Rocks
Turn your class discussion of rock formation from ho-hum to holy hornfels! Junior geologists gain experience in identifying rock types and rock origins, with an emphasis in hypothesizing the environment needed to form certain rocks. The...
Curated OER
The Potential Consequences of Climate Variability and Change
Students analyze the impact of climate variability and change utilizing a broad span of topics over a wide range of grade levels. This three lesson unit is easily adapted for the various instructional levels listed.
Curated OER
Science: How's the Weather?
Fifth graders brainstorm meteorological terms to create a semantic web using SuperPrint. For each topic, they create instruments, such as barometers or psychomotors, that they use to make scientific predictions about the weather. After...
Curated OER
Weather, Data, Graphs and Maps
Students collect data on the weather, graph and analyze it. In this algebra lesson, students interpret maps and are able to better plan their days based on the weather reading. They make predictions based on the type of clouds they see.
Curated OER
Weather Gradients
In this weather gradients learning exercise, students solve 7 problems which include finding the temperature and pressure gradients between different cities in the United States. They use a table from their book that gives them the...
Curated OER
Hurricanes on Track
Fifth graders develop a questionnaire to investigate weather in different part of the US. They investigate how weather in one part of the country affects weather in another part. They predict the development of hurricanes.
Curated OER
Cloudy With a Chance of Meatballs
The classic book, Cloudy With a Chance of Meatballs lesson, is used to help readers compare and contrast the weather in Chewandswallow to their own town. Students write their own fantasy weather story. This lesson is intended to be an...
Curated OER
Reading A Weather Map
Ninth graders construct a weather map. In this meteorology lesson, 9th graders construct a weather map using contour lines and temperature.
Curated OER
Water Cycle, Weather, and Climate
Eighth graders investigate the water cycle and its processes. They examine temperature and precipiation data to classify climate of ten cities. They then create a climate map of the world.


