Curated OER
What is a Cloud
Third graders study clouds and how they are formed. They write acrostic poems about clouds and analyze and graph temperature data collected during varying degrees of cloud cover.
Curated OER
Understanding Cloud Formation
Students explore air and clouds by watching demonstration. They perform an experiment to measure air pressure changes.
Curated OER
Temperature Comparisons
Students practice plotting temperature data points on a line graph in groups and examine the temperature differences at the same time of year. They graph the temperatures in Lannon, WI, and Mitchell's Plain, SA. After the data has been...
Curated OER
Measuring Temperature: Celsius
In this measuring temperature, Celsius, worksheet, students study, analyze and discuss how temperature tells us how hot or cold something is. Students measure the Celsius degrees of five temperatures.
E-learning for Kids
E Learning for Kids: Science: South Africa: What Is the Weather Like Today?
Join Tim and Johnny on their voyage to South Africa, but before they get there they need to make sure they understand the weather conditions. This interactive module helps you describe the weather, learn about basic forecasting and how...
CK-12 Foundation
Ck 12: Earth Science: Collecting Weather Data
[Free Registration/Login may be required to access all resource tools.] Describes the various instruments that scientists use to measure weather conditions, including advanced tools like satellites and radar.
The Franklin Institute
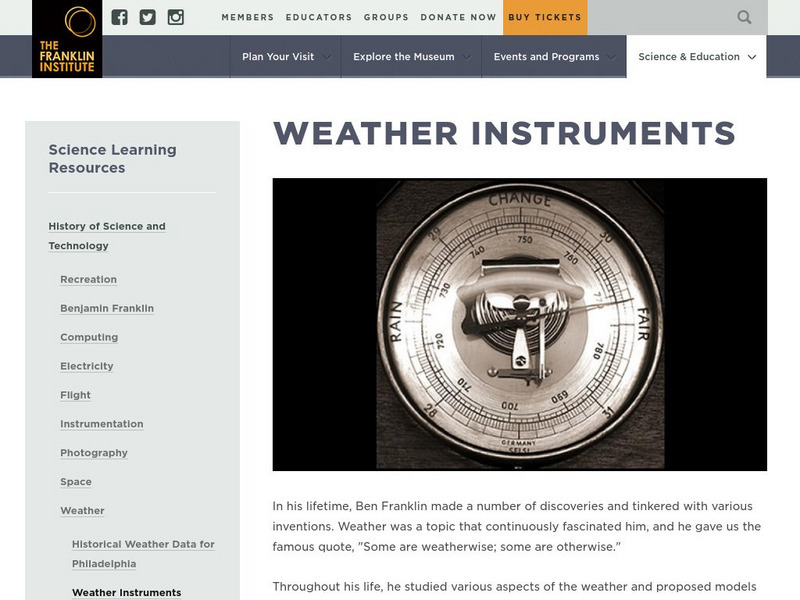
Franklin Institute: History of Science and Technology: Weather Instruments
A look back in time at weather instruments used in previous centuries. Includes pictures and descriptions of instruments from Franklin Institute's historical collection.
Dan Satterfield
Dan's Wild Weather Page: Temperature
Use this site to find out about temperature and how to read a thermometer.
Other
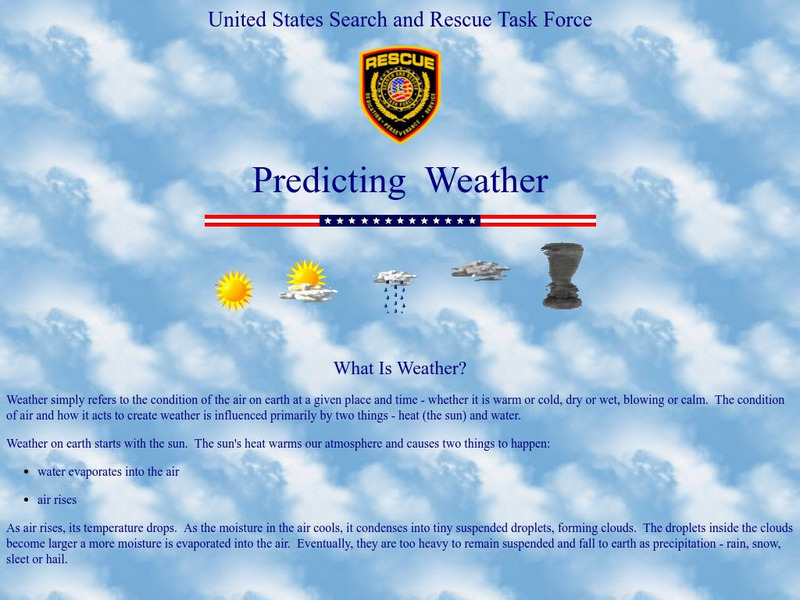
U.s. Search and Rescue Task Force: Predicting Weather
Information on what weather is to begin with, then progresses to how scientists can predict the weather. Common ways to predict weather are also included such as use of a barometer and rain gauge.
Science Education Resource Center at Carleton College
Serc: Measuring and Comparing Temperatures
Using thermometers, students will compare differences in the temperature of various materials and locations. They will record and chart the data that was collected and present the graphs to their classmates.
Mocomi & Anibrain Digital Technologies
Mocomi: Recording Daily Weather
Learn about weather forecasting, the different gadgets used to predict the weather, and other interesting facts.
University of Illinois
University of Illinois Extension: Tree House Weather Kids: Seasons and Temperature: How Do We Measure Temperature?
Animated interactive teaches young researchers about scales and devices used to measure temperature.
Utah Education Network
Uen: Sun or Shade?
Use a thermometer to measure the air temperature in several places around the school.
Other
Gpb: Talking Up a Storm
Learn about the tools meteorologist use to predict changes in the weather patterns. Understand how these tools help them give us an accurate forecast.
Science Education Resource Center at Carleton College
Serc: Phenology Weekly
A long-term project lesson plan where students observe seasonal changes by recording observations and data of the weather conditions. Students will understand how to use a light meter, thermometer, anemometer, and rain gauge with this...
Curated OER
Science Kids: Science Images: Hotter Temperature Graphic
This is a graphic used to show that the temperature has increased or is increasing. It features a thermometer and an arrow pointing upwards which indicates that the temperature is getting hotter.


