Curated OER
Storm That Drowned a City
Students use a map to locate New Orleans and watch a video on the destruction of Hurricane Katrina. As a class, they watch a demonstration on how a wetland can reduce the impact of a hurricane. In groups, they perform their own...
Curated OER
Weather: Piecing It All Together
Fourth graders collect, record, and analyze data using simple weather instruments and a variety of weather resources to investigate weather. They observe the teacher demonstrate how a rain gauge functions, record the weather for five...
Curated OER
Forecast the Weather
Students analyze different weather conditions before creating their very own first-person report from the eye of a storm. They use maps to analyze different weather conditions, record an online weather script
and write a first-person...
Curated OER
How Does Your KinderGarden Grow
Students find forecast and graph weather by using WeatherBug site, create flower books by using Wiggleworks, and plant radish seeds both on KidPix and in class garden.
E Reading Worksheets
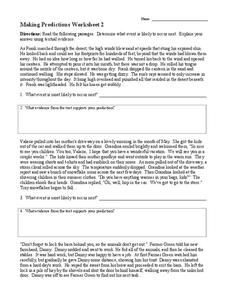
Making Predictions #2
What happens next? Learn to make predictions with five short passages. As kids finish reading each passage, they jot down what they think will happen next, as well as the evidence from the text that supports their prediction.
It's About Time
Slinkies and Waves
Slinkies® are a great tool for visualizing waves. Pupils work in groups to create both transverse and longitudinal waves before using a polarizer to analyze the ways they are able to travel.
National Energy Education Development Project
Introduction to Solar Energy
People have been using solar energy for many generations to dry crops, heat homes, and for light. This presentation explains how now it is possible to capture the solar energy and store it for future use, details how and where people use...
University of Colorado
Great Red Spot Pinwheel
The great red spot on Jupiter is 12,400 miles long and 7,500 miles wide. In this sixth part of a 22-part series, individuals model the rotation of the Great Red Spot on Jupiter. To round out the activity, they discuss their findings as a...
Chicago Botanic Garden
Weather or Not
What is the difference between weather and climate? This is the focus question of a instructional activity that takes a deeper look at how weather data helps determine climate in a region. Using weather and climate cards, students decide...
Chicago Botanic Garden
Recent Weather Patterns
Decide whether weather is changing! A two-part activity first challenges classes to review the differences between weather and climate. Once finished, individuals then analyze historical data to determine if climate change is happening...
Curated OER
Build Your Own Weather Station
Studens experiment with temperatures. In this science lesson, students make their own weather station by heating one bottle and keeping the water in another bottle at room temperature.
Curated OER
Surface Meteorological Observation System (SMOS)
Students monitor local surface weather conditions for at least 30 days. They interpret the data by graphing it and detemining percentages.
Curated OER
Weather Prediction
For this weather worksheet, students review vocabulary words and concepts associated with predicting the weather. Students understand what a meteorologist studies. This worksheet has 7 matching, 10 fill in the blank, and 5 short answer...
Curated OER
Weather Conditions During the Spring Monarch Migration
Students keep detailed weather records during the spring migration of the monarch butterfly. To keep track of the weather, students utilyze weather reports and instuments such as anemometers, compasses, thermometers and rain gauges.
Curated OER
Weather Conditions During the Fall Monarch Migration
Students keep detailed weather records during the fall migration of the monarch butterfly. They compare weather conditions to the days they do and do not see monarchs. As a class, they graph and analyze data and send it to a university...
Curated OER
Exploring Weather Websites
Students research and locate their own weather data using a weather website. They examine how to locate valid information on the www.weather.com website, and explore the website. Next, they select a city they want to visit, and compare...
Curated OER
Creating Station Models
Students work in groups to interpret weather maps. They use latitude and longitude readings to complete a worksheet together and turn in the worksheet along with the maps and a rubric.
Curated OER
The Science of Hurricanes
Students explore hurricanes. In this science lesson, students discuss the aspects of hurricanes and watch videos of hurricanes. Students discuss the motion of the hurricanes.
Curated OER
Mapping a Refuge
Students record observations gathered while at a national wildlife refuge. In this instructional activity on wildlife refuges, students choose an observation spot and record seasonal changes throughout the year.
Curated OER
Tracking Local Weather
In this activity, studens will use different types of weather gauges and track the local weather for a week. After the week is over, students will collect their samples, analyze the data, and compare their conclusions to local weather...
Curated OER
Tracking Hurricanes
Students explore how technology and science are used to identify, measure, and track powerful tropical storms to better warn and secure people from their impact. They research hurricanes online by tracking the storms on a hurricane website.
Curated OER
Weather Watchers
Learners practice using objective and quantitative means to describe and compare the weather. They compile weather conditions and create a spreadsheet to record their findings.
Curated OER
Weather and Climate Around the World
Students explain the difference between climate and weather. They gain concepts of currents and discuss how the currents have an affect on climate and weather. Students gain knowledge of the instruments that meteorologists use to predict...
Curated OER
Meteorologist for the Day
Fourth graders examine the symbols used on weather maps. They analyze a newspaper weather forecast and identify and discuss the various symbols used on the map. Next, they prepare a weather map for their own city using the symbols...


