Virginia Department of Education
Linear Curve of Best Fit
Is foot length to forearm length a linear association? The class collects data of fellow scholars' foot length and the length of their forearms. They plot the data and find a line of best fit. Using that line, they make predictions of...
Curated OER
Review of Linear Equations
In this algebra worksheet, students solve linear equations and rewrite them in the form y=mx + b. They graph the equations using the slope and y-intercept. There are 22 questions with an answer key.
Curated OER
Introduction to Functions
Students explore functions, function rules, and data tables. They explore terms of linear functions. Students use computers to analyze the functions. Students write short sentences to explain data tables and simple algebraic expressions.
Curated OER
Be the Kiwi
Young scholars analyze linear equation. In this algebra lesson, students analyze and graph data. They solve problems involving linear equations and graph lines using the slope and y intercept.
Curated OER
Linear Functions
Students solve, identify and define linear equations. In this algebra lesson, students calculate the slope and y-intercept of a line. They graph the line given two points and the slope.
Curated OER
Whose Line is it Anyway?
Students solve systems of equations. In this algebra lesson, students identify the domain and range of each function. They use the slope and y-intercept to graph each line.
Curated OER
Graphing Linear Equations with Calculator
Students graph lines using the calculator. In this algebra lesson, students graph lines of equations in the form y=mx+b. They input equations into the TI Calculator and graph using the slope and intercept. They analyze the graph for...
Curated OER
Properties of Logarithms
Students explore the concept of logarithms. For this logarithms lesson, students graph logarithms on their Ti-Nspire calculator. Students describe the shapes of their graphs by identifying slope, y-intercepts, and roots. Students...
University of North Texas
Math Exam 1 Review
Perfect as a review guide, this worksheet provides a range of questions focusing on functions. Topics include composing functions, transformations, domains, and polynomials. Also included are corresponding worksheets focusing on other...
West Contra Costa Unified School District
Introduction to Inverse Functions
Ready to share the beauty of the inverse function with your classes? This algebra II instructional activity guides the discovery of an inverse function through a numerical, graphical, and an algebraic approach. Connections are made...
Virginia Department of Education
Transformation Investigation
Graph it! Investigate transformations with a graphing calculator. Pupils graph sets of linear functions on the same set of axes. They determine how changes in the equation of a linear function result in changes in the graph.
Curated OER
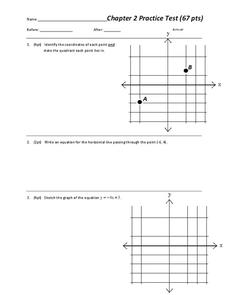
Chapter 2 Practice test
Overall, this worksheet contains a good selection of problems that reviews different aspects of linear equations. Learners examine and graph linear equations, absolute value equations, and inequalities in two variables. The three page...
Curated OER
Drug Sales Soar - Rate of Change
In this prescription drug activity, students answer short answer questions and create graphs on the sales of prescription drugs over a five year span. Students complete six questions.
Curated OER
Linear and Quadratic Functions
In this algebra worksheet, 11th graders solve quadratic functions using the quadratic formula. They take the square roots of both side of each equation then graph both the linear and quadratic functions. There are a total of 84 problems...
Curated OER
Graphing Linear Equations
In this calculator active graphing activity, students graph 12 equations via a calculator and transfer the graphs onto coordinate grids.
Curated OER
How Long Can You Go?
Eighth graders examine the usefulness of a line of best fit by collecting and graphing data, using a graphing calculator to determine the line of best fit, and making a variety of predictions. They watch a video, then design a...
Curated OER
Graphing Inequalities in Two Variables
This study guide is a great resource to help you present the steps to graphing linear inequalities. Show your class two different ways to graph an inequality and work on a real-world example together. The document could also be easily...
Curated OER
Linear and Exponential Models
Students investigate the differences between linear and exponential models. In this linear and exponential models lesson, students make a table of given data. Students determine if the data is linear or exponential by plotting the data...
Curated OER
Graphing Systems of Inequalities
Solve equations and graph systems of inequalities. Designed as a instructional activity to reinforce these concepts, learners revisit shading and boundaries along with solving linear inequalities.
Curated OER
Chapter 2 Practice Test
In this algebra activity, students examine and graph linear equation, inequalities, and absolute value inequalities in two variables. The three page activity contains forty-six problems. Answers are not included.
Curated OER
Investigating Linear Equations Using Graphing Calculator
Learners investigate linear equations using the Ti-Calculator. In this algebra lesson, students graph lines and identify the different quadrants on a coordinate plane. They identify ordered pairs used to plot lines.
Curated OER
Real World Systems of Linear Equations
Students solve systems of equations with fluency. For this algebra lesson, students graph, use elimination and substitution to solve systems of equations. They identify the point of intersection using algebra.
University of Texas
A Library of Parent Functions
Don't think this lesson is for Mom and Dad; parent functions are all for your high schoolers. Flip through a presentation with a focus slide on each type of graph and its characteristics. Some examples are included but the focus is on...
Curated OER
Inquiry Unit: Modeling Maximums and Minimums
Young mathematicians explore the maximun area for patio with the added complexity of finding the mimimum cost for construction. First, they maximize the area of a yard given a limited amount of fence and plot width v. area on a scatter...


