Curated OER
Who Shares My Function?
Young scholars differentiate between linear and quadratic functions. In this algebra lesson, students write equations of graphs and graph a function from an equation. They also move the graph around on the coordinate plane.
Curated OER
US Population 1982-1988
Your algebra learners make predictions using the concepts of a linear model from real-life data given in table form. Learners analyze and discuss solutions without having to write a linear equation.
Curated OER
Sandia Aerial Tram
Your learners analyze a table of real-life data in order to write an equation that best models the information. Exponential, quadratic, and linear rates of changes are all possibilities in this task.
Curated OER
Find Parabolas through Two Points
Your learners will write quadratic functions whose graphs include specific points and explore how these graphs are related to each other.
Radford University
Buying A Car
What is my monthly payment? Scholars research to find the perfect car for them to buy. Using the cost of the car, they determine a down payment and the amount of monthly payments using a zero interest loan. Finally, they investigate what...
Curated OER
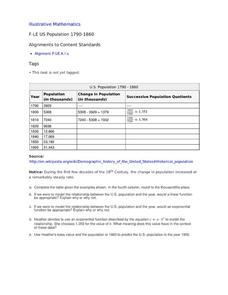
US Population 1790-1860
Your young population scientists analyze a table of values, write a model to represent the real life data, finish the table of data and predict future populations in a collaborative, real-life activity.
Curated OER
Very Varied - Inverse variation
Students identify inverse variations. For this inverse variation lesson, students explore graphs and identify the inverse variation. They write equations for the inverse variation. Students compare and contrast the inverse variation...
Curated OER
More Graphing Situations by Making a Table
Students calculate rate of change and graph linear functions. In this algebra instructional activity students write linear functions, make a table of points and graph their data on a coordinate plane. They calculate the rate of change of...
Ms. Amber Nakamura's Mathematics Website
Algebra Project
What would your dream house look like? A cottage? A medieval castle? High schoolers enrolled in Algebra design the perfect house while using slopes to write equations for various aspects of the project.
Curated OER
Intersecting Graphs
Ninth graders know how to solve a system of linear equations, but what happens when the system involves an exponential function? The instructional slideshow teaches viewers to determine solutions to systems of equations with linear and...
Curated OER
Price of Apples- Linear Data
Students collect data and create a graph. In this algebra lesson, students describe functions graphically, algebraically and verbally. They identify functions as being independent and dependent using variables.
Curated OER
Numerical Analysis: Solving Systems Of Non-Linear Equations
In this numerical analysis learning exercise, students solve systems of non-linear equations. Examples and explanation are provided. This two-page learning exercise contains approximately three problems.
Curated OER
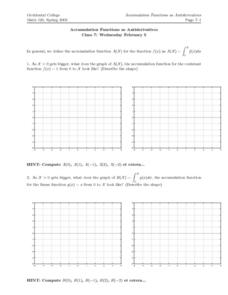
Accumulation Functions as Antiderivatives
For this accumulation functions worksheet, students describe the graph of an accumulation function for a constant function. Students describe the link between the slope of the graph of the accumulation function and the value of the...
Curated OER
Using a Graph to Solve a System of Linear Equations
In this Algebra I/Algebra II worksheet, students use graphing to solve a system of linear equations. The one page worksheet contains one multiple choice question. Answer is included.
Inside Mathematics
Quadratic (2009)
Functions require an input in order to get an output, which explains why the answer always has at least two parts. After only three multi-part questions, the teacher can analyze pupils' strengths and weaknesses when it comes to quadratic...
Radford University
Create A Ramp Design
Ramp up a design challenge. Class members design ramps to meet a client's requirements to comply with the American with Disabilities Act. The scholars create a scaled graph of their designs and determine the equations of the lines on...
Virginia Department of Education
Logarithmic Modeling
Explore logarithms and logarithmic regression. Young mathematicians first learn about inverse functions and about the logarithm function family. They take their newfound knowledge to use logarithmic functions to model situations and...
West Contra Costa Unified School District
Exploring Quadratics and Graphs
Young mathematicians first graph a series of quadratic equations, and then investigate how various parts of the equation change the graph of the function in a predictable way.
Mathematics Assessment Project
Best Buy Tickets
Everyone wants the best price when shopping — no matter what they are trying to buy. Given pricing information, pupils must solve a system of equations to determine the best option for printing tickets.
EngageNY
Arithmetic and Geometric Sequences
Arithmetic and geometric sequences are linear and geometric patterns. Help pupils understand the relationship and see the connection with an activity that asks them to write the rules and classify the patterns correctly. A sorting...
Curated OER
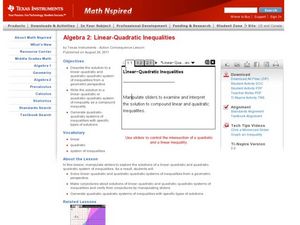
Linear-Quadratic Inequalities
Students graph linear and quadratic functions. In this algebra lesson plan, students create graph with specific coordinate points. They use the Ti to visualise and differentiate between the two functions.
Curated OER
Complex Analysis: Linear Transformations
In this linear transformation activity, students find a series of linear transformations and sketch them. This four-page activity contains approximately six problems.
Curated OER
Investigating Linear Equations Using Graphing Calculator
Learners investigate linear equations using the Ti-Calculator. In this algebra lesson, students graph lines and identify the different quadrants on a coordinate plane. They identify ordered pairs used to plot lines.
Curated OER
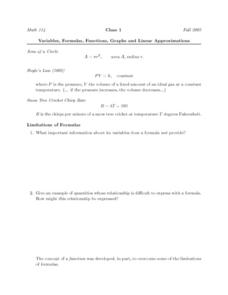
Variables, Formulas, Functions, Graphs and Linear Approximations
In this limitations of formulas worksheet, students answer four essay questions about functions. Two questions refer to the limitations of formulas. They graph one function and explain how it specifies the rule of the function.


