Curated OER
Water in the Texas Coastal Basins
Learners, after researching a Texas coastal basin, map and graph the information they collect and then translate it into a short report to be presented to their classmates. They brainstorm unique ways to maintain Texas estuaries as well...
Curated OER
Stochastic and Deterministic Modeling
Explore the difference between stochastic and deterministic modeling through programming. First have the class write algorithms for relatively simple tasks using pseudocode. Use the Python 2.7 program app to simulate Mendel's Pea Pod...
EngageNY
Two Graphing Stories
Can you graph your story? Keep your classes interested by challenging them to graph a scenario and interpret the meaning of an intersection. Be sure they paty attention to the detail of a graph, including intercepts, slope,...
Virginia Department of Education
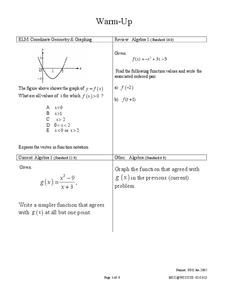
Factoring for Zeros
Relate factors to zeros and x-intercepts. Scholars first graph quadratics in both standard and factored forms to see that they are the same. They go on to use the graphs to see the relationship between factors and x-intercepts.
Curated OER
Baseball Relationships - Using Scatter Plots
Students use graphing calculators to create scatter plots of given baseball data. They also determine percentages and ratios, slope, y-intercepts, etc. all using baseball data and statistics.
Curated OER
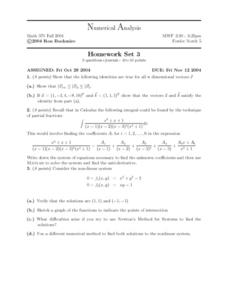
Numerical Analysis: Dimensional Vectors
For this dimensional vector worksheet, students prove dimensional vectors. They write systems of equations, verify solutions, and sketch graphs of the functions. This two-page worksheet contains approximately ten problems.
Curated OER
Lesson Plan On Fran Data
Seventh graders investigate the concept of functions and how they are used in the context of the real world while identifying the dependent and independent variables. They graph relations and functions and find the zeros of functions....
Curated OER
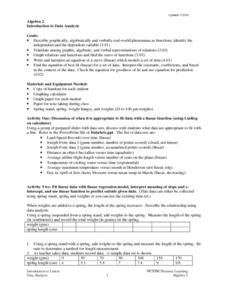
Introduction To Data Analysis
Seventh graders investigate the concept of looking at the data put in a variety of ways that could include graphs or data sets. They analyze data critically in order to formulate some sound conclusions based on real data. Students graph...
Los Angeles County Office of Education
Assessment for the California Mathematics Standards Grade 7
In need of an all-inclusive seventh grade math resource? Packed full of the topics necessary for Pre-Algebra the packet includes practice problems with different difficulty levels. It works great for any supplemental use needed in the...
EngageNY
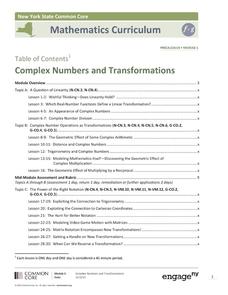
Complex Numbers and Transformations
Your learners combine their knowledge of real and imaginary numbers and matrices in an activity containing thirty lessons, two assessments (mid-module and end module), and their corresponding rubrics. Centered on complex numbers and...
Curated OER
As the Wheel Turns
This is not your typical Ferris wheel problem. For this exercise, your class will combine their knowledge of sinusoidal functions as well as linear motion to come up with parametric equations that model the position of a point on the...
Kenan Fellows
Math Made Simple as 1-2-3: Simplified Educational Approach to Algebra
Writing an equation of a line is as easy as m and b. A lesson plan presentation gives individuals different strategies for writing equations of lines. Some items provide a slope and a point while others provide two points. Whatever the...
Inside Mathematics
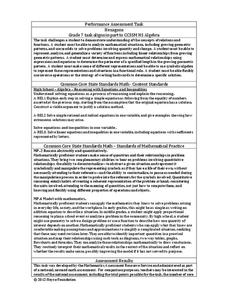
Hexagons
Scholars find a pattern from a geometric sequence and write the formula for extending it. The worksheet includes a table to complete plus four analysis questions. It concludes with instructional implications for the teacher.
PBL Pathways
Solar Toasters
Help a company maximize their profits! A detailed project-based learning activity examines two production scenarios. Your young scholars write a linear demand function. They then apply the function to develop a revenue, cost, and profit...
Ohio Department of Education
I Can Do This! Systems of Equations
Use tables, graphs, and substitution to solve systems of linear equations. An envelope of sample problems is passed around the classroom, and each learner has the opportunity to solve the system in the envelope. This is a great way to...
Curated OER
Graphing Inequalities in Two Variables
This study guide is a great resource to help you present the steps to graphing linear inequalities. Show your class two different ways to graph an inequality and work on a real-world example together. The document could also be easily...
EngageNY
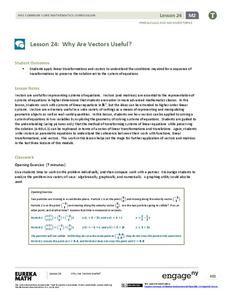
Why Are Vectors Useful? 2
Investigate the application of vector transformations applied to linear systems. Individuals use vectors to transform a linear system translating the solution to the origin. They apply their understanding of vectors, matrices,...
West Contra Costa Unified School District
Derivative – Standard Definition
Making a clear connection to algebra concepts helps learners understand the definition of a derivative. The lesson begins with looking at limits of simple linear and rational functions, and leads to the definition of the derivative....
Alabama Learning Exchange
Bloodstain Pattern Doesn't Lie......
An interesting instructional activity on hypothesizing about the diameter of a drop of blood that is splattered. To test their theories, learners work in groups to make blood droplets splatter from different heights. They use graphed...
Achieve
Stairway
It's the stairway to learning! Scholars research all aspects of building a staircase. Using information from building codes, they write and graph a system of inequalities to analyze the constraints. The completed project is a scale model...
02 x 02 Worksheets
Factoring
Factor in this resource when teaching how to factor polynomials. Scholars use algebra tiles to factor linear and quadratic expressions. They practice their skill by working on example problems from a worksheet.
Concord Consortium
Bill the Ball Bearing Man
Just how durable could a hollow ball bearing be? Learners model the strength of the walls of a ball bearing as a function of the radius of its cavity. They use their models to make reasonable conclusions about the probability of failure...
Curated OER
Mathematical Relationships
Students practice graphing a linear equation and a parabolic equation. They work cooperatively to select numbers, including fractions, which they will put into ordered pairs. Students explain their process to the class, discussing what...
Curated OER
Slippery Slope
Students define patterns, relation and function. In this algebra lesson, students find the slope of a line and write equations of line. They model the slope using real life scenarios.


