EngageNY
Graphing Quadratic Functions from Factored Form
How do you graph a quadratic function efficiently? Explore graphing quadratic functions by writing in intercept form with a lesson that makes a strong connection to the symmetry of the graph and its key features before individuals write...
Virginia Department of Education
Linear Curve of Best Fit
Is foot length to forearm length a linear association? The class collects data of fellow scholars' foot length and the length of their forearms. They plot the data and find a line of best fit. Using that line, they make predictions of...
Ed Migliore
Linear Equations in Two Variables
This traditional textbook style unit includes vocabulary, a direct explanation section, examples, practice problems that directly line up with the explanations and examples, and a unit summary review and practice problems. Learners get...
Balanced Assessment
Getting Closer
Flip the script! Reverse the situation and ask the class to find the function given asymptotes. The task requires class members to use their knowledge of functions and asymptotes to create functions that have a given asymptote or...
PBL Pathways
Death Project
Verify the rule of thumb for finding the time of death. The project-based learning task asks pupils to determine when the rule of thumb process of finding the time of death is appropriate. Learners develop a function for the rule and...
Curated OER
Taylor's Theorem
In this Taylor's Theorem worksheet, students use the microscope approximation to determine the approximate value of a function. They rewrite expressions for the relative error, and observe changes in the relative error. They use...
Curated OER
Linear Functions
In this linear functions learning exercise, students define 5 terms. They solve 6 problems for the specified term. Students graph 3 linear equations. They write the equations for 14 problems using the given information. There are 28...
Curated OER
Linear and Quadratic Functions
In this algebra worksheet, 11th graders solve quadratic functions using the quadratic formula. They take the square roots of both side of each equation then graph both the linear and quadratic functions. There are a total of 84 problems...
Curated OER
Transformations and Exponential Functions
Tenth graders study graphing exponential functions. In this transformations lesson, 10th graders apply inquiry to determine how changes to a parent function affect its graph. Students analyze transformed graphs and generate the function...
Curated OER
Graphing at all Levels: It's a Beautiful Thing!
Mixing math and art is done in this lesson by applying graphing knowledge to create a unique piece of art. This lesson varies acording to the graphing knowledge of the artist. First, learners identify and review various types of graphing...
Curated OER
Graphing Linear Equations
Ninth graders review the information that they have already learned
with regard to linear equations and graphical representations. They then assist in combining equations with a graphical element and complete various graphs with this...
Curated OER
Writing Equations in Slope-Intercept Form
Use this instructional activity to write equations in both point-slope form and slope-intercept form. Start by writing equations given one point and the slope and finish by writing equations given two points and a few real-world...
Curated OER
Graphing Linear Equations - With Table
Learners describe relations and graph linear functions. After studying a geometric shape and a verbal statement, students contrast the differences between the verbal statement and the picture. They determine functions and graph...
Virginia Department of Education
Greetings
Welcome learners to the world of algebra. Use a lesson that poses a situation involving the profit from creating greeting cards to teach about algebra. It requires scholars to use linear functions and inequalities to solve problems.
Howard County Schools
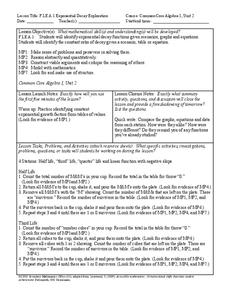
Exponential Decay Exploration
How can you model exponential decay? Explore different situations involving exponential decay functions and decreasing linear functions by performing activities with MandM candy, popcorn kernels, and number cubes.
101 Questions
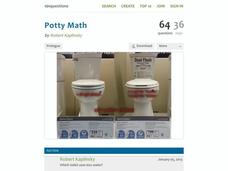
Potty Math
You don't want to flush your money down the drain! Have your classes complete a financial comparison between two different types of toilets. They use linear modeling to determine the most cost-effective model.
Flipped Math
Calculus AB/BC - Approximating a Function's Value Using Local Linearity
No need to be exact every time. Pupils watch an engaging video on approximating function values. They see how to write the equation of a tangent line, use it to calculate approximations, and then determine whether it is an overestimate...
Curated OER
Linear Systems and Calories
High schoolers define and graph properties of linear equations. In this algebra lesson plan, students write systems of equations to represent functions. They relate linear equations to the real world.
Curated OER
Function Composition
High schoolers solve two functions at once. In this algebra lesson, students add, subtract, multiply and divide composition functions. They use the correct notation and substitution to get their answer.
Curated OER
Systems of Linear Equations
Students use the calculator to represent a situation as a table, graph, and equation. They write systems of equations and find solutions to systems of equations. In addition, they explain and justify how they determined their
solutions...
Curated OER
Polynomial Functions
In this polynomial functions worksheet, 11th graders solve and complete 8 different problems that include various polynomial functions. First, they define a polynomial function. Then, students write the polynomial part in standard form...
Curated OER
Algebra II Test Chapter 3: Slope & Functions
In this slope and functions worksheet, students determine the slope of a line. They identify functions and determine an equation of a line that is parallel or perpendicular to given points. This three-page worksheet contains 21 problems.
Curated OER
Piecewise Modeling with Multiple Functions: Federal Debt
Students analyze data on debt and write an equation. In this statistics lesson, students are given data from different time periods, and are asked to graph and analyze the data. They work in groups, and are assigned different parts of...
Curated OER
Functions and Graphing
Graphing functions in a real world application makes math come to life. Learners graph points on a coordinate plane and identify various points on a graph by working through a set of real world problems. This is a perfect review exercise.


