Curated OER
Let's Go Slopey
Students create a table of values to graph a line. In this algebra lesson, students identify the slope and intercept of a linear equation. They use a Ticalculator to graph their function.
Curated OER
Graphing Linear Equations with Calculator
Students graph lines using the calculator. In this algebra lesson, students graph lines of equations in the form y=mx+b. They input equations into the TI Calculator and graph using the slope and intercept. They analyze the graph for...
Curated OER
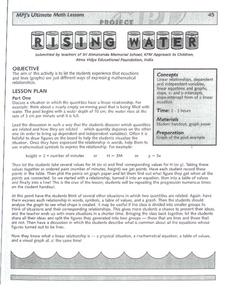
Rising Water
Eighth graders discuss a situation with quantities that relate in a linear fashion. They discuss ways to determine the relationship. Students represent this relationship with mathematic symbols. Students discuss the meaning of...
Curated OER
Graphing Linear Equations
Students graph linear equations. In this algebra lesson, students perform transformation on linear equations. They identify the slope and y-intercept of each line.
Curated OER
Numerical Analysis: Introduction to Approximation Theory
In this introduction to approximation theory, students compute the slope and intercept of a line. They describe nonlinear relationships. This four page worksheet contains approximately five problems.
Curated OER
Properties of Logarithms
Students explore the concept of logarithms. For this logarithms lesson, students graph logarithms on their Ti-Nspire calculator. Students describe the shapes of their graphs by identifying slope, y-intercepts, and roots. Students...
Curated OER
Graphing Review
Students review the principles of graphing linear functions. They discuss plotting points on a coordinate plane, solving using a table, and then graphing. Students solve problems and determine the slope of the line, y-intercept and if...
Curated OER
Reading a Graph: Azimuth Range vs. Day in Barrow Alaska
High schoolers practice reading a graph while doing story problems. They determine the x and y intercepts and calculate the slope. They also practice writing linear equations.
Curated OER
Applying Properties to Variables
Eighth graders combine like terms in this properties of variables lesson. Using named items (stars, moons and hearts), they combine like terms using variables. They use the distributive property to combine like terms. Finally, they write...
University of North Texas
Math Exam 1 Review
Perfect as a review guide, this worksheet provides a range of questions focusing on functions. Topics include composing functions, transformations, domains, and polynomials. Also included are corresponding worksheets focusing on other...
West Contra Costa Unified School District
Graphing Systems
Get hands on with solving systems of equations graphically. A solid lesson plan uses guided practice to show how to solve systems of linear equations. It allows time for sharing ideas and provides a printable matching activity to promote...
Alaska Department of Education
Mathematics Reference Sheet
Triangles and prisms don't stand a chance when your learners use this handout full of the formulas they need to know about the different shapes. Area, volume, and surface formulas are all covered along with the standard measurement and...
Willow Tree
Approximating a Line of Best Fit
You may be able to see patterns visually, but mathematics quantifies them. Here learners find correlation in scatterplots and write equations to represent that relationship. They fit a line to the data, find two points on the line, and...
Curated OER
How Long Can You Go?
Eighth graders examine the usefulness of a line of best fit by collecting and graphing data, using a graphing calculator to determine the line of best fit, and making a variety of predictions. They watch a video, then design a...
Curated OER
Graphing Inequalities in Two Variables
This study guide is a great resource to help you present the steps to graphing linear inequalities. Show your class two different ways to graph an inequality and work on a real-world example together. The document could also be easily...
101 Questions
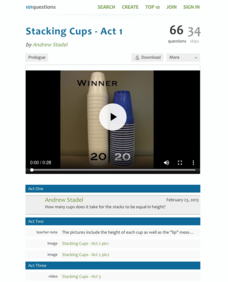
Stacking Cups
Facilitate an understanding of equality using a modeling task. After watching different-sized cups being stacked, learners use their math skills to determine when the height of each cup tower will be the same. Meant as an introduction to...
West Contra Costa Unified School District
Shifting Linear Equations in Function Notation
Time for a shift in thinking! Learners examine translations of linear functions. They use function notation to describe the translation and make connections to the graph.
Curated OER
What Functions do Two Graph Points Determine?
Your algebra learners write linear, exponential, and quadratic equations containing the same two graph points in this collaborative task.
Illustrative Mathematics
Chicken and Steak, Variation 2
Many organizations put on barbecues in order to make money. In a real-world math problem, the money allotted to purchase steak and chicken at this barbecue is only one hundred dollars. It is up to your potential chefs to figure out how...
Curated OER
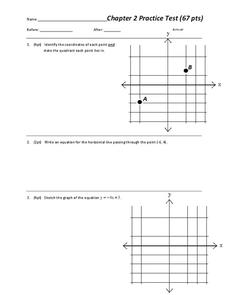
Chapter 2 Practice test
Overall, this worksheet contains a good selection of problems that reviews different aspects of linear equations. Learners examine and graph linear equations, absolute value equations, and inequalities in two variables. The three page...
Virginia Department of Education
Transformation Investigation
Graph it! Investigate transformations with a graphing calculator. Pupils graph sets of linear functions on the same set of axes. They determine how changes in the equation of a linear function result in changes in the graph.
Curated OER
Mr. Payne Word Search Puzzle
In this language arts worksheet, students study 10 words in a word bank, then locate them in a word search puzzle. The words appear to be related to algebra; the meaning of the title is not known. There is one misspelled word in the word...
Curated OER
Linear and Quadratic Functions
In this algebra worksheet, 11th graders solve quadratic functions using the quadratic formula. They take the square roots of both side of each equation then graph both the linear and quadratic functions. There are a total of 84 problems...
Curated OER
Graphing Linear Equations
In this calculator active graphing activity, students graph 12 equations via a calculator and transfer the graphs onto coordinate grids.


