Curated OER
Cartesian Geometry
In this geometry worksheet, learners plot coordinate pairs and connect the points to create different shapes. They give th shapes its polygon's name. They differentiate between simple functions and rectangular hyperbola.
Curated OER
Lines of Fit
Students analyze graphs. In this algebra lesson, students find the line of best fit, using scatter plots. They calculate the sale of popcorn as it relates to the price. They then analyze the graphs for positive, negative and no correlation.
Curated OER
AP Calculus Practice Exam: BC Version - Part A
In this calculus worksheet, students solve 28 multiple choice problems. Students find derivatives, volumes, limits, convergent series, etc.
Curated OER
AP Calculus Practice Exam
In this calculus worksheet, students solve functions by taking the derivative of the equations. There are 28 questions using logs and trig functions.
Curated OER
Worksheet 1, Basic Calculus Pre-Course Review
In this calculus worksheet, learners review topics they need to already understand in order to be successful in a basic calculus course. Topics include functions, linear equations, coordinate graphing, piece-wise formulation, exponents,...
Curated OER
Systems of Equations
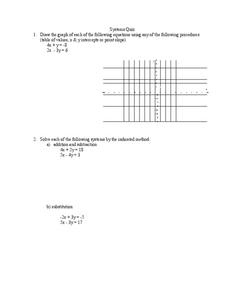
In this algebra worksheet, students solve systems of equation through graphing, linear combination and substitution. There are 3 questions.
Curated OER
Linear Functions: Are You Ready for the REAL World?
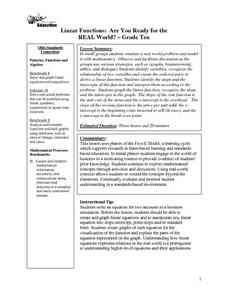
students emulate a real world problem and model it with mathematics working in a small group. Observe and facilitate discussion as the groups use various strategies, such as (graphs, brainstorming, tables, and dialogue.
Curated OER
Graphing System of Equations
Students solve system of equation. In this algebra lesson, students graph, substitute and eliminate to solve system of equation. They identify the point of intersection and how many solution each system will have.
Curated OER
Twenty-Eight Multiple Choice No Calculator Allowed AP Calculus BC Practice Exam
In this AP Calculus BC practice exam, learners solve twenty-eight multiple choice problems without the use of a calculator. This worksheet should be completed in fifty-five minutes.
Curated OER
AP Calculus Practice Exam
For this Calculus worksheet, students are provided with problems of a similar nature to those on their exam. Problems include limits, derivatives, and integrals. The four page worksheet contains twenty-eight problems. Answers are not...
Curated OER
Two Variable Inequalities
In this algebra worksheet, students solve inequalities using addition, subtractions and multiplication. They graph the inequalities with shading. There are 2 questions.
Curated OER
Proportionality in Tables, Graphs, and Equations
Students create different methods to analyze their data. In this algebra lesson plan, students differentiate between proportion and non-proportional graph. They use the TI-Navigator to create the graphs and move them around to make their...
Curated OER
Linear Equations Project Fram
Students engage in a lesson plan that focuses on the concept of linear equations. They practice solving problems with a variety of problems and graphing the solution set for each. Students write a summary paragraph about two methods of...
Curated OER
High School Mathematics Problems from Alaska: Reading a Graph: Azimuth Range vs. Day in Barrow, Alaska
High schoolers focus on reading and interpreting information from a graph.
Oswego City School District
Regents Exam Prep Center: Slopes and Equations of Lines
Explanation of linear equations and four types of slopes: positive, negative, zero, and undefined. Practice problems for the students are provided and a reinforcement activity using a graphing calculator is offered for the teacher's use.
Columbia University
Columbia University: Slope Intercept Form
This site from the Columbia University in the City of New York provides brief information on the slope-intercept form, and then has four helpful examples on the subject. Each example goes through the steps involved and arrives at a...
Texas Education Agency
Texas Gateway: Determining Intercepts and Zeros of Linear Functions
Given algebraic, tabular, or graphical representations of linear functions, the student will determine the intercepts of the graphs and the zeros of the function.
Texas Instruments
Texas Instruments: X (Or Y) Marks the Spot
Students will identify x- and y-intercepts graphically. Students will calculate the slope between 2 points. Students will write the equation of a line in slope-intercept form when given the graph of the line.
Texas Education Agency
Texas Gateway: Determining the Meaning of Intercepts
Given algebraic, tabular, and graphical representations of linear functions, the student will determine the intercepts of the function and interpret the meaning of intercepts within the context of the situation.
Concord Consortium
Concord Consortium: Linear Equations: Points, Intercepts, and Slopes, Oh My!
Learn how to graph lines with two methods: using x- and y-intercepts and using point-slope form.
CK-12 Foundation
Ck 12: Algebra: Intercepts by Substitution
[Free Registration/Login may be required to access all resource tools.] Identify x and y-intercepts when problem solving.
Texas A&M University
Wtamu Virtual Math Lab: College Algebra: Equations of Lines
This tutorial covers x & y intercepts, point-slope form, slope-intercept form, graphing, and more. Use the practice problems at the end to check your skills.
McGraw Hill
Glencoe Mathematics: Online Study Tools: Quiz on Graphing Linear Equations
Students show comprehension of advanced mathematical concepts in Algebra II. The questions check understanding on graphing linear equations. Topics include x-intercepts, y-intercepts, graphing, and slope-intercept form.
Texas Instruments
Texas Instruments: Graphic Line Designs
Students can use the x- and y-intercepts to find the equations of lines and create a line design using the slope-intercept form and the limited domain of the segment.


