Climate Literacy
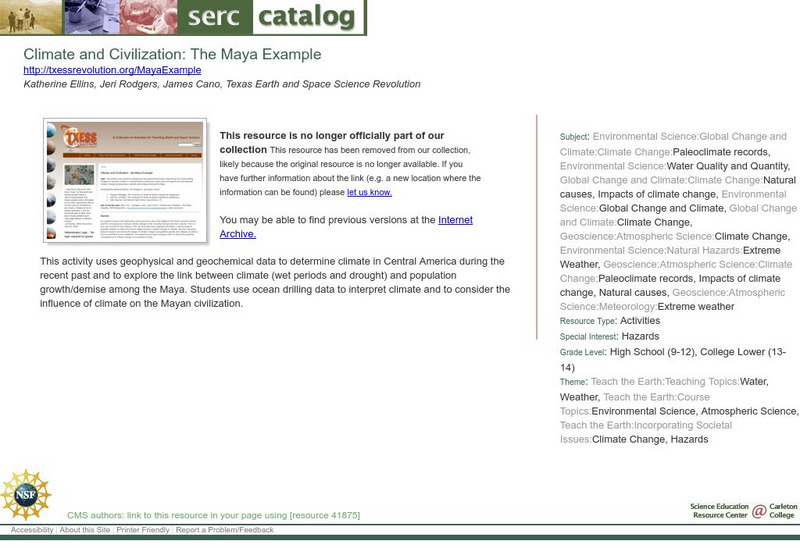
Clean: Climate and Civilization: The Maya Example
Students use geophysical and geochemical data collected by the Ocean Drilling Program to examine climate in Central America during the recent past. They also have the opportunity to investigate the link between climate change and...
Climate Literacy
Clean: Climographs: Temperature, Precipitation, and the Human Condition
A instructional activity where students learn how to read, analyze, and construct climographs which display monthly average temperature and precipitation. Students also practice matching climographs to various locations and summarize...
Climate Literacy
Clean: Greenhouse Gas in a Bottle Demonstration
A simple demonstration that is quick and easy to setup and provides dramatic evidence of the effect on temperature of an atmosphere with increased carbon dioxide. [4 min]
Climate Literacy
Clean: Mt. Pinatubo and the Atmosphere
This lesson explores the impact of volcanic eruptions on the atmosphere. Students will analyze three types of visual information: a graph of aerosol optical depth v. global temperature, a global map with temperature anomalies, and an ash...
Climate Literacy
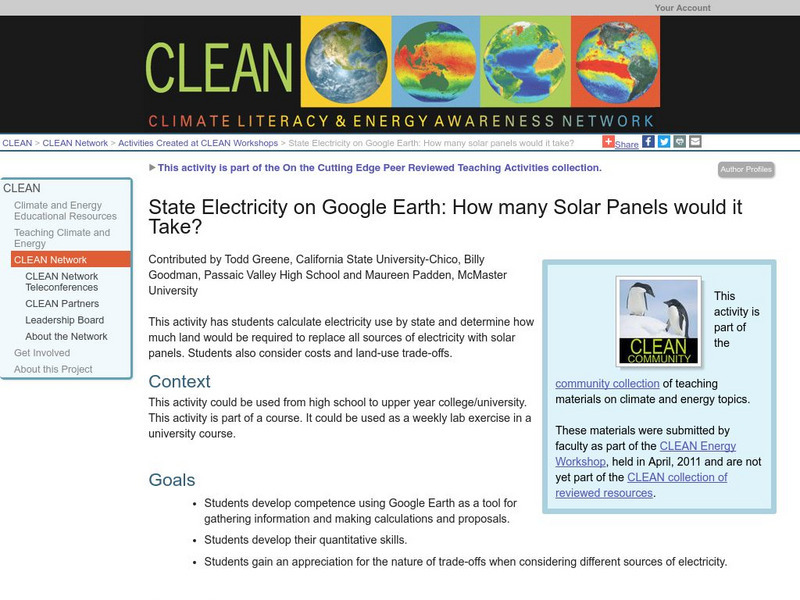
Clean: State Electricity on Google Earth: How Many Solar Panels Would It Take?
This activity addresses the Energy Awareness Principle by having students calculate electricity use by state, and also determine how much land would be required to replace all sources of electricity with solar panels considering costs...
Climate Literacy
Clean: Carbon Dioxide Sources and Sinks
In this lab activity, students use a chemical indicator (bromothymol blue) to detect the presence of carbon dioxide in animal and plant respiration and in the burning of fossil fuels and its absence in the products of plant...
Climate Literacy
Clean: Us Energy Production and Consumption
In this lesson learners will compare and contrast regional energy production of 5 different US regions, including California, Illinois, Pennsylvania, Texas, and Washington. Students will also analyze production and consumption data of US...
Climate Literacy
Clean: Getting to the Core of Climate Change
Young scholars investigate climate changes going back thousands of years by graphing and analyzing ice core data from Greenland and Antarctica. They use information about natural and human-caused changes in the atmosphere to formulate...
Climate Literacy
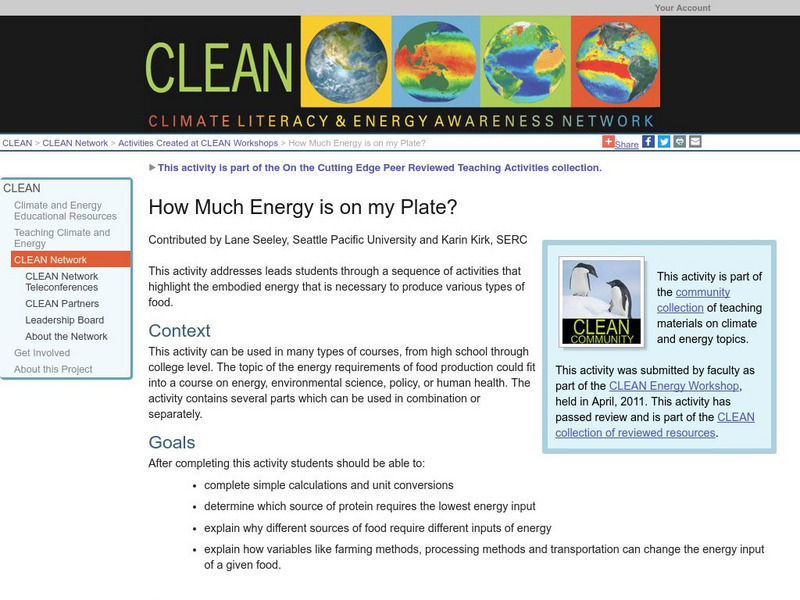
Clean: How Much Energy Is on My Plate?
Using concept sketches, students study energy requirements of food production explain why different sources of food require different inputs of energy. They also investigate how variables like farming methods, processing methods and...
Climate Literacy
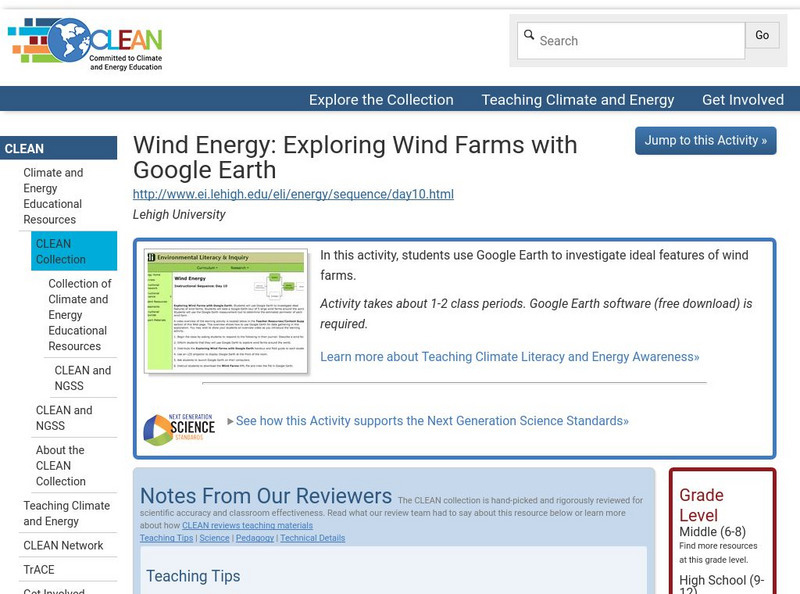
Clean: Wind Energy Using Google Earth
In this activity learners will use Google Earth to investigate ideal features of wind farms and they will use the Google Earth measurement tool to determine the estimated perimeter of each wind farm.
Climate Literacy
Clean: Carbon Cycle Game
In this interactive, regionally-relevant carbon cycle game, students are challenged to understand the role of carbon in global climate change. They imagine that they are carbon molecules and travel via different processes through carbon...
Climate Literacy
Clean: Ecological Footprint
Students explore their own ecological footprint in the context of how many Earths it would take if everyone used the same amount of resources they did. They compare this to the ecological footprint of individuals in other parts of the...
Climate Literacy
Clean: Seasonal Temperature Pattern Variation in Different Regions of the World
Students use GLOBE climate science visualizations to display student data on maps and to learn about seasonal changes in regional and global temperature patterns.
Climate Literacy
Clean: Climate Change on the Antarctic Peninsula
In this cross-curriculum inquiry, students use a cooperative approach to investigate the effect of climate change on the ecosystem of the Antarctic Peninsula. The activity stresses the importance of evidence in the formulation of...


